“Hollowing Out” in U.S. Manufacturing: Analysis and Issues for Congress
29 Nov 2013
By Marc Levinson for Congressional Research Service (CRS)

Introduction
The health of the U.S. manufacturing sector has been a major concern of Congress for more than three decades. Over the years, Congress has enacted a wide variety of tax preferences, direct subsidies, import restraints, and other federal programs intended to bolster the manufacturing sector, often with the goal of retaining or recapturing highly paid manufacturing jobs.
Only a small proportion of U.S. workers is now employed in factories, as manufacturers have shifted low-value, labor-intensive production, such as apparel and shoe manufacturing, to other countries. Meanwhile, U.S. factories have stepped up production of goods that require high technological sophistication but relatively little direct labor. Despite highly publicized factory closures, the good-producing capacity of the U.S. economy remains near its all-time peak, as measured by the Federal Reserve Board.
Recent data, however, challenge the belief that the manufacturing sector, taken as a whole, will continue to flourish. In particular, statistics showing that domestic value added represents a diminishing share of the value of U.S. factory output have been interpreted by many analysts as indicating that manufacturing is “hollowing out” as U.S. manufacturers undertake more high value work abroad. Economic data have been slow to take note of this development, which raises the question of whether the United States will continue to generate highly skilled, high-wage jobs related to advanced manufacturing.
This report discusses economic evidence related to the “hollowing out” thesis with respect to the manufacturing sector. It then considers the policy implications of the debate.
The Health of U.S. Manufacturing
The United States has a very large manufacturing sector. In 2011, manufacturers’ shipments reached $5.4 trillion, more than one-third of the gross domestic product and 11% above the level of 2010. Although many factories closed or reduced production during the 2007-2009 recession, output has rebounded since the summer of 2009. In February 2013, the Federal Reserve Board’s index of industrial production in manufacturing reached the highest seasonally adjusted level since June 2008, only 4% below the high recorded in December 2007.[1]
This cyclical recovery, however, has not stilled concerns about the sector’s health. The number of U.S. manufacturing sites fell from 397,552 in 2001 to 335,553 as of September 2012, leaving many factories abandoned.[2] Manufacturing employment, which peaked at 19.4 million in 1979, was 11.98 million in March 2013. Of those 12 million manufacturing workers, only 8.3 million, or 5.4% of the civilian labor force, are now engaged in factory production work. The remaining 3.7 million manufacturing workers are engaged in management, product development, marketing, and other nonproduction activities conducted within manufacturing establishments.
These broad trends—generally expanding manufacturing output coupled with minimal job creation - are of long standing. In combination, they are taken as indicators of rapidly rising productivity. Labor productivity in U.S. manufacturing, defined as output per work hour, has increased 16% since 2005 and 45% since 2000 as manufacturers have shifted away from labor-intensive production. A rapid rise in productivity would be consistent with the belief that U.S. manufacturing is becoming more efficient and technologically sophisticated and therefore requires less labor; one analogy might be the farm sector, in which the labor force has shrunk to a small fraction of its size a century ago despite a vast increase in output.
The estimates of rising manufacturing output and capacity and of rapidly improving labor productivity, however, rely critically on price adjustments that attempt to account for improvements in the quality of computers and certain other high-technology products. Such adjustments are required because, for example, simply measuring changes in the quantity or value of the computers produced each year would have little economic meaning given the very rapid increase in those computers’ capabilities.[3]
Government statistical agencies address this problem by making highly technical adjustments when measuring certain prices. These adjustments can affect prominent economic indicators, such as gross domestic product and labor productivity. The industries for which data are adjusted in this way, such as semiconductor manufacturing, are among the most vigorous in U.S. manufacturing, leading to questions about whether reported improvements in manufacturing represent real changes or are merely the result of statistical adjustments.[4]
While some data thus indicate that U.S. manufacturing is resilient and recovering well from the 2007-2009 recession, two facts in particular support the argument that the manufacturing sector is more challenged than the government’s output and productivity measures imply:
• Unlike previous expansions, the two most recent cyclical upturns in the U.S. economy have not brought more jobs in manufacturing. Factory output rose roughly 20% from the trough of the 2001 recession through 2007 without generating factory jobs. This pattern has repeated itself since June 2009; both total manufacturing employment and manufacturing production employment in March 2013 were only 2% higher than at in June 2009, the deepest point of the 2007-2009 recession, despite a 20.8% increase in factory output.
• By some measures, value added by U.S. manufacturing establishments appears to represent a declining share of the value of factory shipments. If this measurement is correct, although total factory output is rising, the measured contribution of U.S. workers to the value of the final products may not be keeping pace. Some commentators refer to this phenomenon as “hollowing out.”
What Is Value Added?
Value added represents one measure of the health of manufacturing. Conceptually, value added equals the value of manufacturers’ shipments less the value of purchased inputs. Employees’ pay and benefits, depreciation of capital investment, business income taxes, and returns to business owners all are components of value added. In essence, value added is meant to capture the share of the value of final products that is being added “in house.” Value added is typically assessed with two different metrics. One metric, the growth rate of “real” value added, provides information about the expansion of industrial output but is subject to the technology-related adjustment issues discussed above. The other metric, which avoids these adjustment issues, is the ratio of each year’s manufacturing value added to that year’s manufacturing shipments.
For an individual firm, a decline in the ratio of value added to shipments may not be meaningful. To see why, consider a firm that produces a component, uses the component to make another product, and sells that product. If the firm were to split itself in half, so that one entity makes the component and sells it to a separate entity that makes the finished product, manufacturers’ total shipments would increase but total value added would not change. The resulting decline in the ratio of value added to shipments would have no economic significance.
The situation may be different, however, at the level of an industry or of the manufacturing sector as a whole. In these cases, a lower ratio of value added to shipments could reveal important changes. One might be diminished profitability. Another might be that manufacturers’ costs for certain inputs, such as electricity or paperboard cartons, are rising faster than the prices manufacturers receive for their products. A third possibility could be that manufacturers are collectively making greater use of imported parts and components.
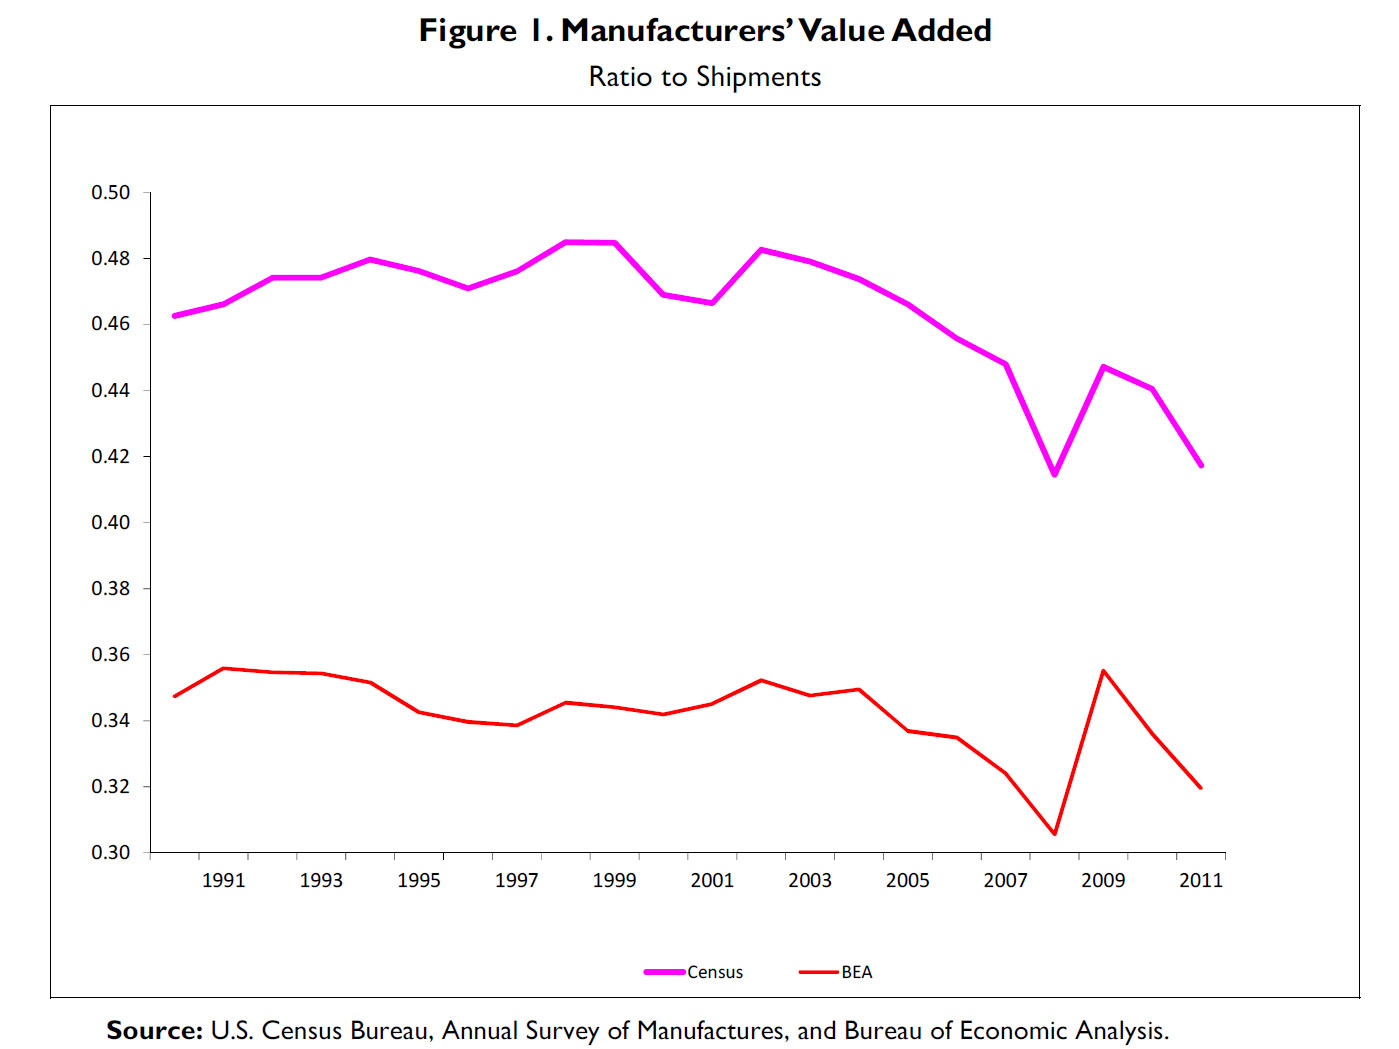
From 1990 through 2005, U.S. manufacturing value added fluctuated in a narrow range, between 46.3% and 48.5% of the value of manufacturers’ shipments, according to Census Bureau estimates. Since 2006, however, the ratio has remained below 44.8% (see Figure 1). The decline in the ratio, which began in 2003, predated the 2007-2009 recession. The ratio of value added to shipments as measured by the Census Bureau was 41.7% in 2011, well below the average of the past two decades.
Data compiled by the Bureau of Economic Analysis (BEA), using different methods, show a generally similar trend, save for a spike in the manufacturing value-added ratio in 2009. According to BEA’s estimates, the value-added ratio was 31.95% in 2011 and 32.5% in the first half of 2012, well below the 34.3% average since 1987.[5]

The interpretation of the trends in the two data series reported in Figure 1 is a matter of controversy among economists. A number of conceptual issues and statistical deficiencies complicate interpretation. Among the most important of these problems are the following.
• Accounting for purchased services. The Census Bureau includes manufacturers’ outlays for telecommunications, advertising, transportation, and other services purchased from third parties in their value added, but BEA does not. This is the main reason the Census measurement of value added relative to sales is normally 9 to 12 percentage points higher than the BEA measurement. Census treats services purchased by manufacturers differently from materials purchased by manufacturers, which are excluded from its measurement of value added. Conceptually, there is no reason for this difference, but until recently the government lacked reliable data on purchased services, and a change in the Census methodology now would affect long-term comparability.[6]
• Accounting for research and development. Government statistics include the costs of a manufacturer’s research and development staff in value added in the same way as the costs of its production employees. Economists have long debated whether research and development should be treated instead as investment. BEA estimates that this accounting change would have raised the annual growth rate of value added in private industry slightly between 1995 and 2007, and that it would have caused value added in certain high-tech sectors, notably pharmaceutical, instrument, and aerospace manufacturing, to grow faster than official statistics indicate. BEA will begin publishing data treating corporate research and development spending as investment in 2013.[7]
• Intellectual property exports. Many companies conduct research and development in the United States and use or license the resulting designs, patents, and brand names for manufacturing abroad. In principle, if this intellectual property is licensed to a foreign producer, whether or not owned by a U.S.-based company, it appears in U.S. trade data as a services export. However, the measurement of value added can become blurred if the foreign-made product is then imported into the United States to be incorporated into other goods; U.S. data on manufacturing may not adequately correct for the fact that some of the import’s value was originally created in the United States or may categorize that U.S. value added as a product of the service sector rather than the manufacturing sector. Moreover, if the intellectual property is licensed from a U.S. operation to a foreign operation with a single multinational company, the licensing fee may not reflect the true economic value of the intellectual property. These complexities tend to make U.S. manufacturing value added appear smaller than it really is, and this bias may have increased over time as “offshoring” of assembly work has become more common.
• Factoryless manufacturing. A growing number of companies widely considered to be manufacturers—perhaps the best known is the electronics company Apple Inc.— specialize in certain processes, such as design, distribution, or service, but perform little or no physical production themselves.[8] The activities of such “factoryless manufacturers” may show up in government data as “wholesale trade” rather than as “manufacturing,” leading to the possibility that an increasing proportion of products with high U.S. value added are being omitted from the calculation of manufacturing output and value added. If this occurs, it may have contributed to the measured decline in the value-added ratio through most of the past decade. New internationally agreed statistical procedures would change the treatment of outsourcing by basing measurement of goods exports and imports on transfer of ownership.[9] Conceptually, for example, if a company makes semiconductors in Texas, ships them to Mexico for assembly into a finished product, and then sells the finished product in the United States, the value of the semiconductors would henceforth count neither as an export nor as an import, and the value of the assembly work in Mexico would count as a U.S. import of manufacturing services rather than of goods. U.S. statistical agencies are still evaluating whether they can obtain the data necessary to measure trade in this way.[10] According to a recent study by three Federal Reserve Board economists, if “factoryless manufacturing” is reclassified as a manufacturing activity rather than a wholesale trade activity, both total manufacturing shipments and U.S. value added in manufacturing are likely to be significantly larger than under current statistical procedures.[11]
• Price biases. Import price indexes play a critical role in measuring value added in manufacturing. Around 40% of all imports are inputs for business use, such as parts and components, rather than consumer goods. Government statistics may understate the declines in input prices if manufacturers are shifting quickly from using a domestic input to a competing foreign-made input that is lower in cost. If this is occurring, it would mean that U.S. factories are using a greater quantity of the foreign input than assumed, and less of the domestically made alternative. These measurement problems may result in official data overstating the output of U.S. manufacturing workers, and hence their productivity, while understating the use of imported components in U.S. factories. This implies that value added in U.S. factories may be lower than statistics indicate.[12]
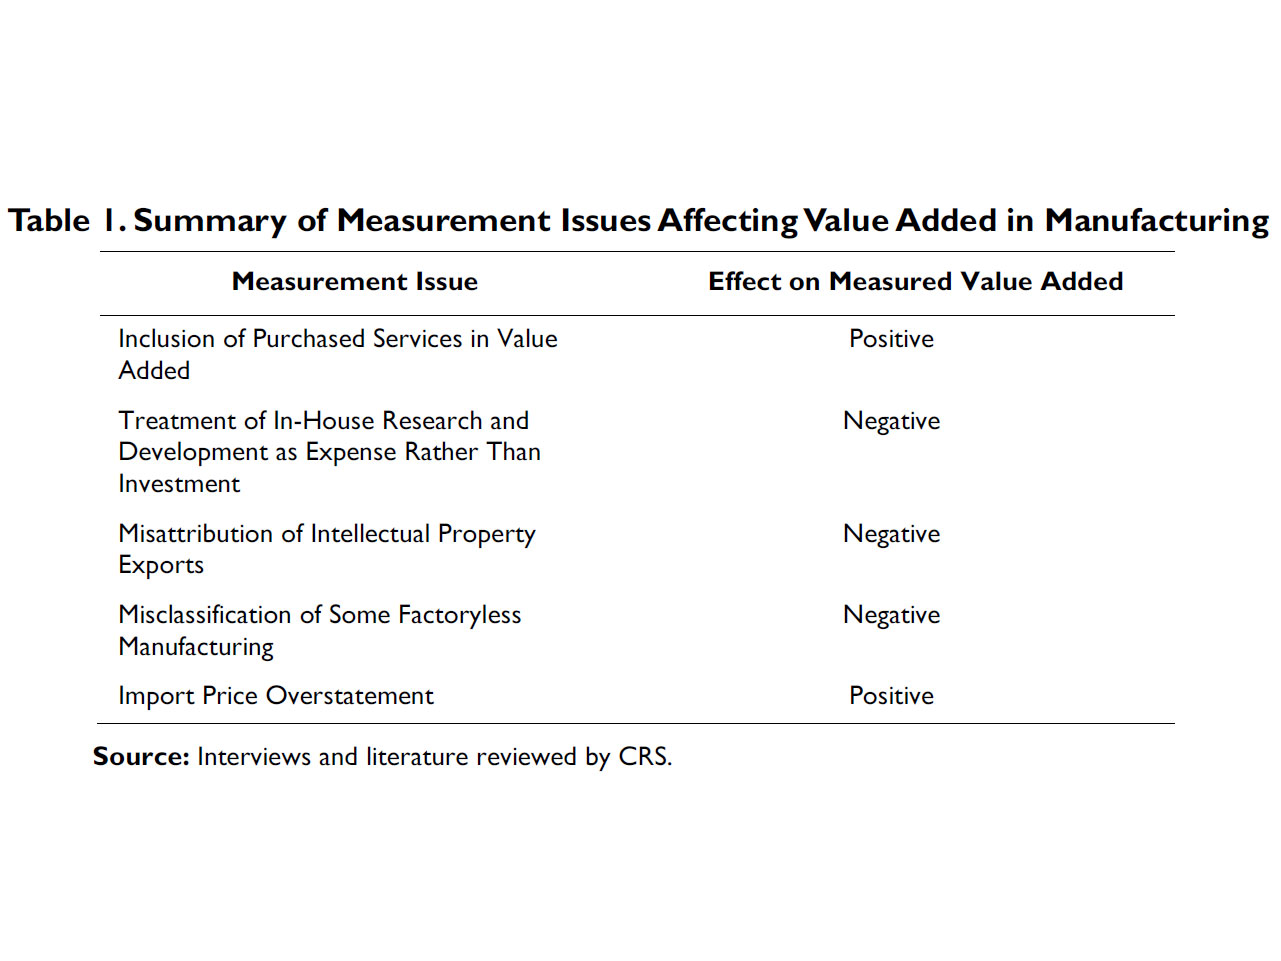
Table 1 summarizes the effects of these various measurement issues on reported value added in the manufacturing sector. The net effect is ambiguous. Although the statistical problems are serious, it is uncertain, on balance, whether they collectively make value added larger or smaller, relative to manufacturers’ shipments, and whether they change the growth rate of value added in manufacturing.
The Impact of Global Supply Chains
The declining share of domestic value added in particular industries is related to a broad change in businesses’ strategies that emphasizes the use of global supply chains.[13] In such arrangements, made possible by low freight transportation and communication costs, a retailer or manufacturer organizes its production on a worldwide basis rather than on a country-by-country basis. It may then obtain economies of scale in manufacturing by using a factory in one country to supply most or all of its need for a particular product worldwide, shipping intermediate inputs from place to place for additional processing in order to deliver the final product at the lowest total cost.
The globalization of supply chains manifests itself in the increased use of imported inputs—so called “intermediate inputs”—by manufacturers. This trend is strongly in evidence in the United States.[14] In 1998, 24% of intermediate inputs used in U.S. manufacturing were imported. According to one analysis, the figure started rising in 2003 and reached 34% in 2006. Moreover, U.S. factories’ use of domestic components and other materials (excluding energy) is estimated to have declined at an annual rate of 3.9% between 1998 and 2006, while their use of imported components and materials is estimated to have risen at a 3.5% rate.[15]
One consequence of increased reliance on international supply chains has been an increase in the share of manufactured goods’ final value that is imported. This appears to be the case not just for the United States, but globally. According to a recent study for the World Bank, “For the world as a whole, there has been a discernible drop in the value added content of exports, relative to gross exports, since 1992.” In 1992, for example, 45% of the value of machinery exports worldwide was added in the exporting country; by 2007, that figure had fallen to 35%. In the case of transportation equipment, value added in exporting countries accounted for 37% of export sales in 1992, but only 27% in 2007.[16]
If domestic value added relative to sales is a valid measure of “hollowing out,” then the United States may be experiencing less “hollowing out” than other major trading nations, at least with respect to exports (see Figure 2). According to 2009 data compiled by the Organisation for Economic Co-operation and Development (OECD) and the World Trade Organization (WTO), the United States ranked third among 40 countries in the share of export value produced domestically, and ranked first in share of domestic value added in exports of electrical and optical equipment.[17]
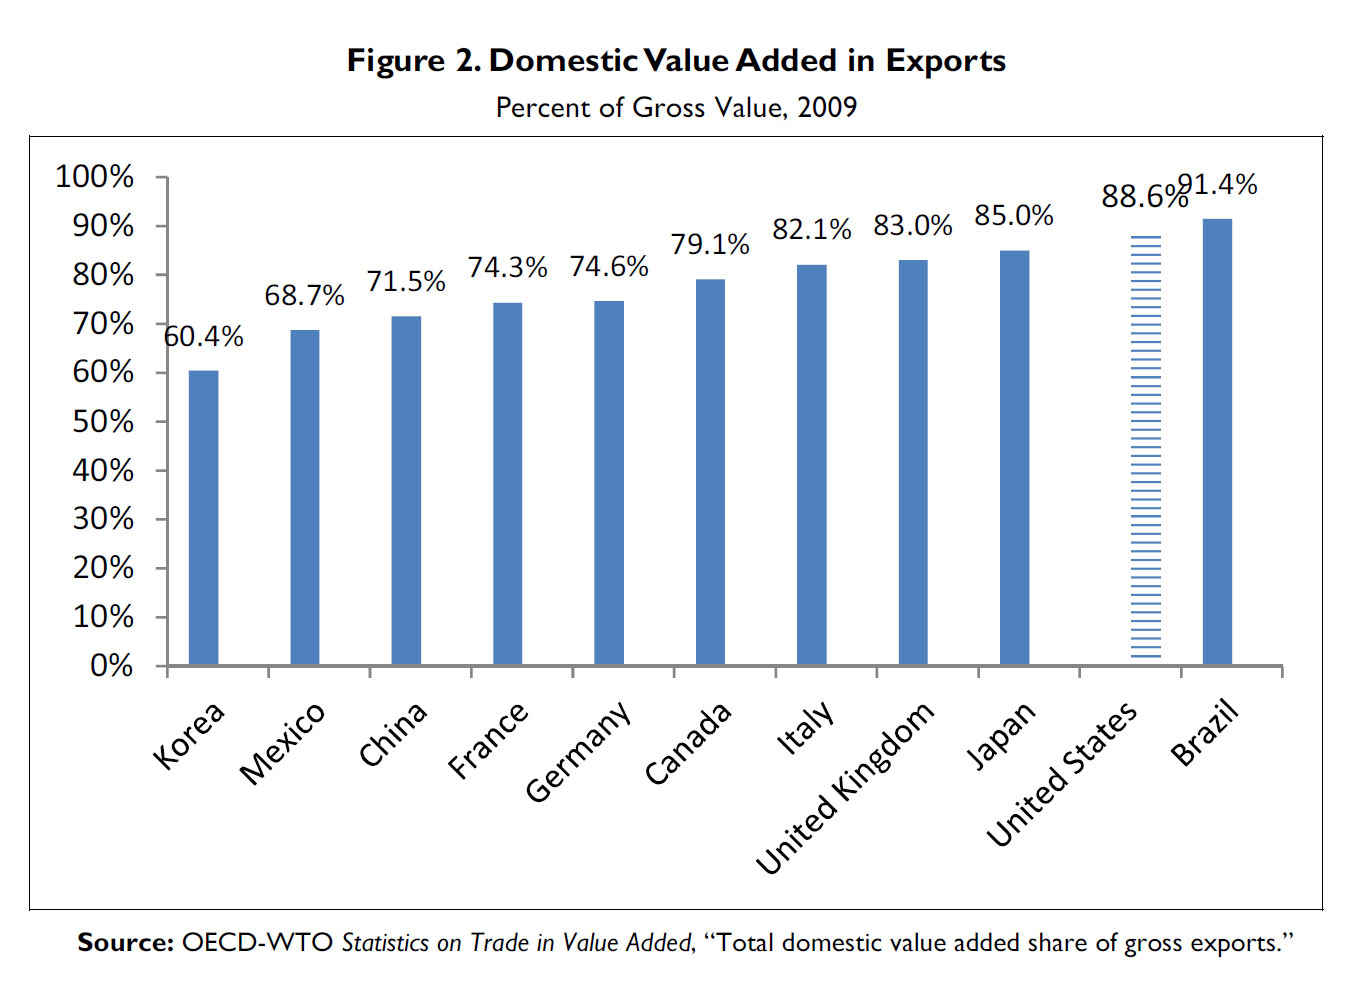
The data used in Figure 2 attempt to incorporate the value of imported services in foreign value added, alongside the value of imported components and raw materials. In principle, for example, if a Chinese component producer pays a licensing fee to a U.S. firm for use of a patent and then exports the resulting component to the United States, the licensing fee should count as imported value added in the Chinese export, and it should not count as imported value added in the U.S. product made with the Chinese component. However, the extent to which inputs imported into the United States contain value added in the exporting country, the United States, or third countries is uncertain due to the same conceptual factors that complicate analysis of U.S. value added in manufacturing.
A recent study of the automotive seat industry illustrates the potential for confusion about the impact of global supply chains on national economies. U.S. imports of automobile seats have declined since 1994, suggesting, at first glance, that auto manufacturers are making greater use of U.S. content. More detailed analysis, however, shows that imports of seat parts, mainly from Mexico, have increased sharply. These imports consist of items such as fabrics and temperature control devices, which may not be readily identified as auto-related.[18] Collectively, such imports reduce the amount of measured U.S. content in the seat and in the vehicle in which the seat is installed.[19] However, it may not be possible to determine the value of U.S. licenses and patent fees paid by the manufacturers of those imported fabrics and temperature-control devices. If that U.S.-origin intellectual property has accounted for an increasing share of the value of the foreign made seat components over time, then the reported decline in the domestic content of finished seats may be entirely spurious.
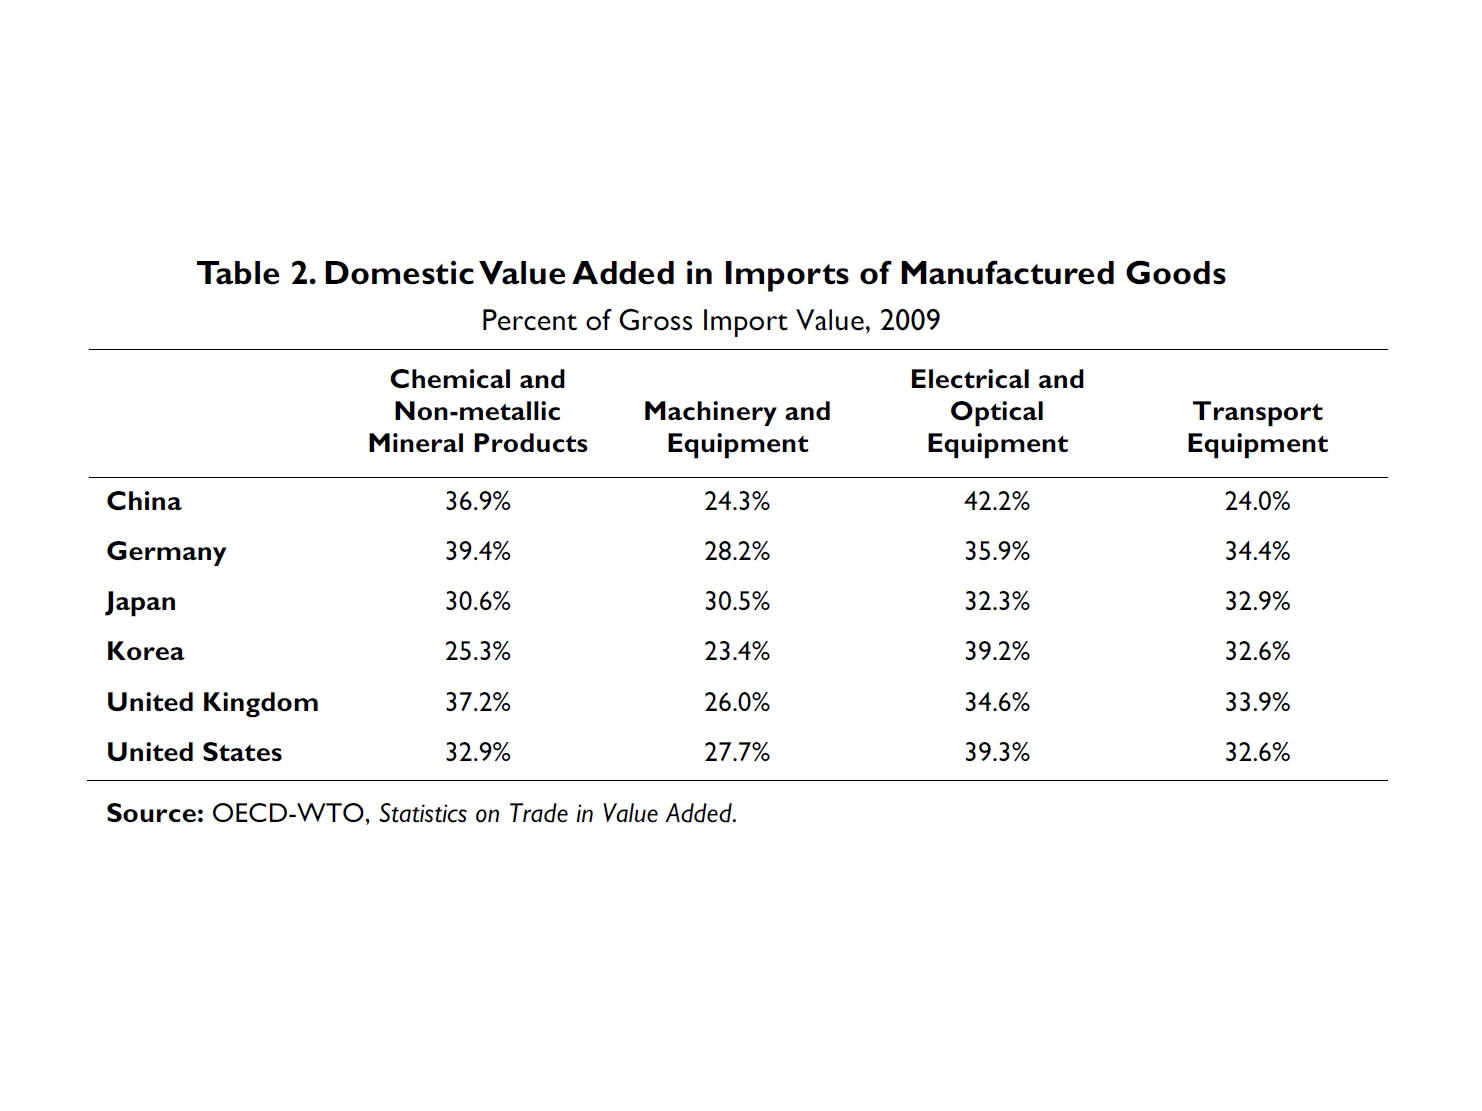
Data on the amount of U.S. content embedded in imported products have been developed only recently, and change over extended time periods cannot be tracked reliably. Data on various manufacturing sectors from the OECD-WTO database indicate that the United States is similar to other major manufacturing countries in the share of import value that can be attributed to domestic production (see Table 2).[20]
Evidence of the tenuous link between output and value added can be seen in China’s soaring exports of what U.S. trade data label “advanced technology products,” or ATP, including specified electronic and biotechnology goods. While China’s bilateral trade surplus with the United States in such products soared from 2002 through 2006, all of the increase was due to processing of foreign components in Chinese factories owned, at least in part, by foreign investors. Although U.S. exports to China were lower than Chinese exports to the United States, “It appears that ATP exports from the United States to China are dominated by large scale, sophisticated, high-valued equipment and devices at the high end of these industries’ value-added chains, while ATP exports from China to the United States are mainly small scale final products or components in the low end of the ATP value-added chain,” a recent study concluded.[21]
It is questionable whether such studies are able to fully account for all trade conducted within global supply chains. In many instances, for example, imported inputs into U.S. manufacturing are likely to have been developed in the United States. In 2012, the United States booked $43 billion of exports of industrial process fees, including royalties and licensing fees, associated with production of goods, compared with $23 billion of imports (see Figure 3).[22] These fees represent payments for intellectual property developed by manufacturing-related companies in the United States but used for physical production abroad.
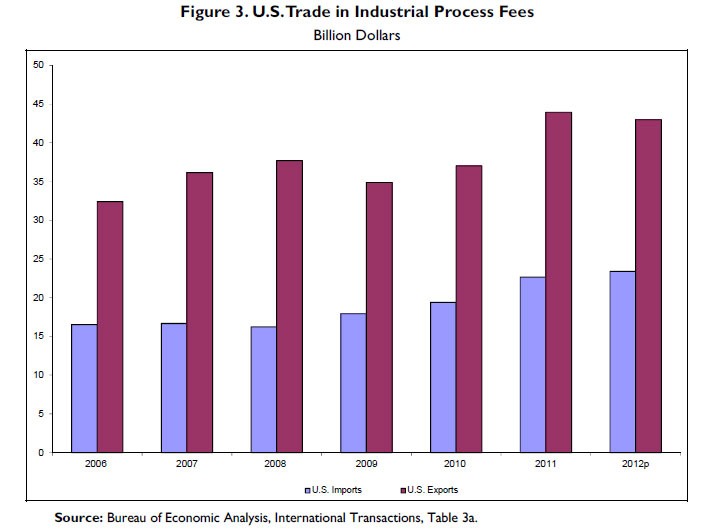
The true value of industrial process exports may be much larger than these official data indicate. Some 73% of reported exports of industrial process royalties and fees in 2012 stemmed from sales by a U.S. company to an affiliated company abroad, and the exporters are free to value those intra-firm transactions as they choose when they report them on BEA form BE-125. Those exports go disproportionately to countries where income from royalties and licenses receives favorable tax treatment: in 2011, 14% of U.S. industrial process exports went to Ireland and 13% to Switzerland, while only 4% went to China.[23] These factors suggest that it is a common practice for U.S. manufacturers to initially assign licenses to their affiliates abroad, resulting in a one-time U.S. export of industrial process royalties and fees, after which the repeated relicensing by those affiliates to third parties would not be reported as U.S. exports.
The difficulty in tracing the flow of funds related to intellectual property used in manufacturing has major implications for the measurement of value added. Consider, for example, an industrial process developed by workers at a manufacturing firm in the United States, licensed by the U.S. firm to its Irish affiliate, and then licensed by the Irish affiliate to a Chinese manufacturer. The Chinese firm would make payment to Ireland, not to the United States; if the U.S.-origin value added in its product is captured in international trade statistics at all, the value would be only the arbitrary amount for which the U.S. firm initially transferred the rights to Ireland. Therefore, if the Chinese firm exports the manufactured good to the United States, trade statistics may not capture the U.S.-origin value in the Chinese export. And if the Chinese export is an input into a final product manufactured in the United States, the share of U.S. value added in the final product may be underestimated because the true value of the U.S.-origin license used in making the input will not be included.[24]
Industrial process royalties and license fees are not the only services exports that may be intimately connected with manufacturing. Unfortunately, U.S. data are not sufficiently detailed to reveal the extent to which other services exports are supplied by manufacturing firms in the United States. However, the available data suggest that services likely to have been produced by U.S. manufacturers accounted for approximately $94 billion of U.S. exports in 2011.25 If a substantial amount of this U.S.-origin value was incorporated into foreign-made products that were then exported to the United States, value added in U.S. manufacturing might be higher than the $1.7 trillion officially reported by BEA.
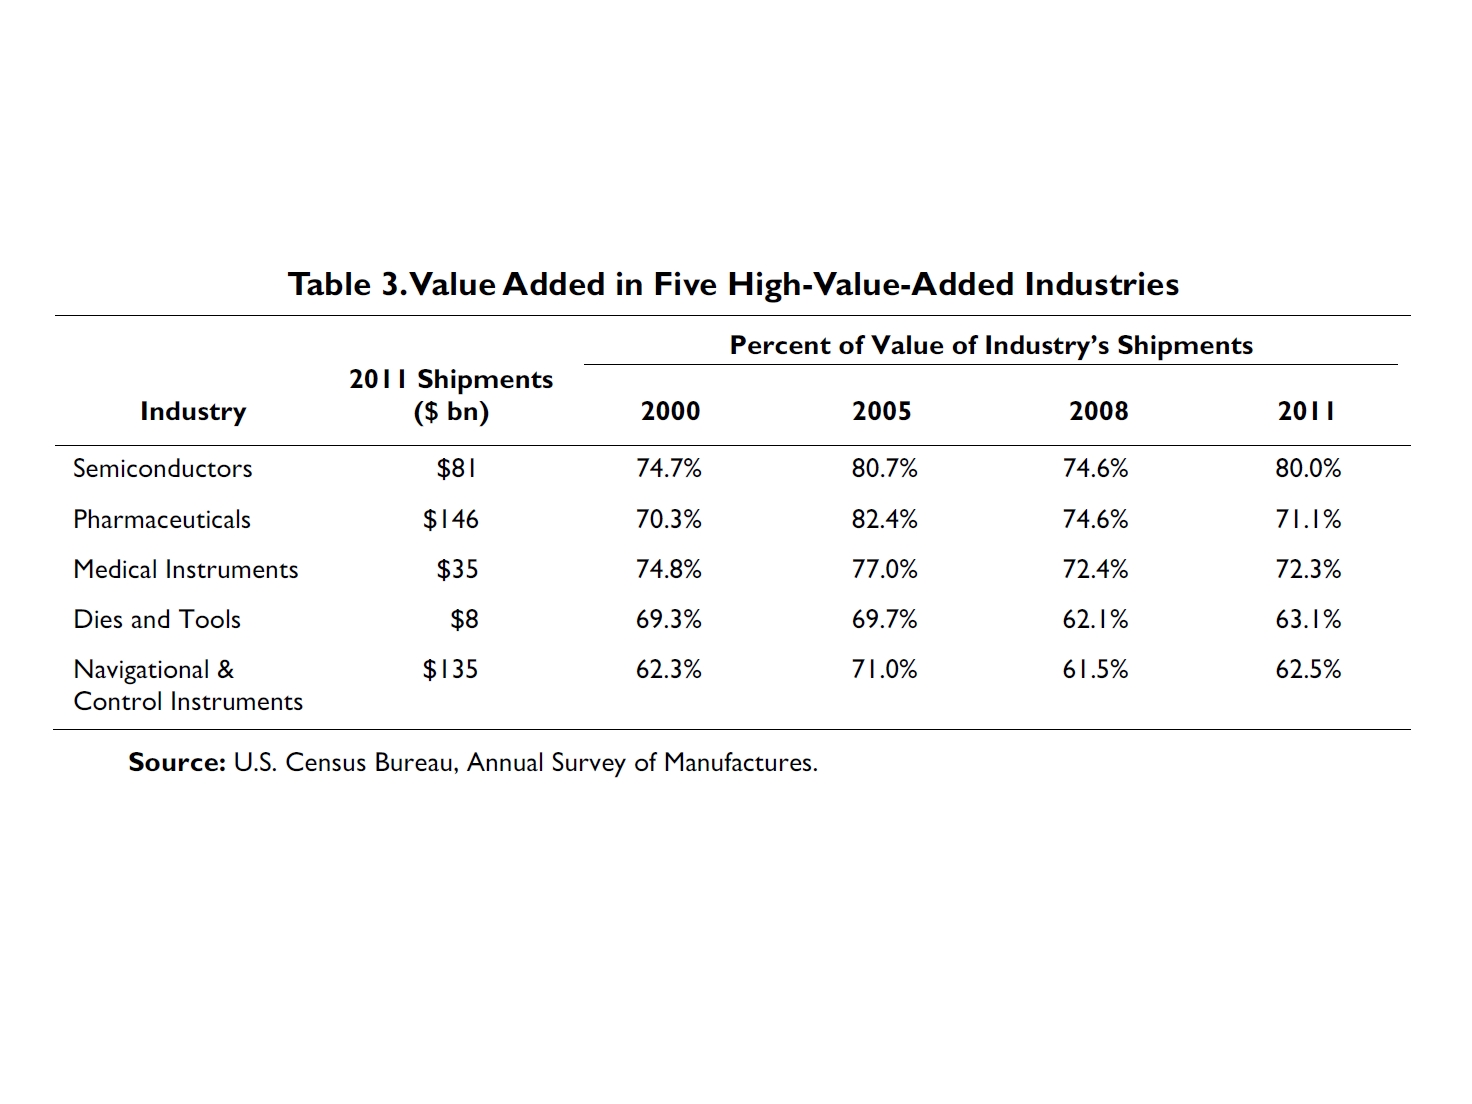
Industry-level data suggest that increased use of imported components may be occurring in some manufacturing industries that traditionally have high value added relative to shipments. These industries typically are intensive users of scientific research and advanced technology, and are often regarded as industries in which the United States should have an international competitive advantage. The pharmaceutical, medical instrument, tool and die, and navigation and control instrument industries have exhibited declining ratios of domestic value added to shipments over the last five years (see Table 3). However, all of these industries are vulnerable to the mis-measurement issues discussed above, as their imported inputs may be likely to draw on intellectual property and other services originating in the United States.
The data discussed in this report shed light on a concern frequently raised in the context of national security, that U.S. manufacturers of vital products are critically dependent upon inputs from abroad. Evidence suggests that while the output of U.S. factories contains substantial foreign value added, many other countries are even more dependent upon foreign value added than is the United States, at least with respect to goods traded in international markets.
Issues for Congress
As the research surveyed in this report emphasizes, traditional understandings of “manufacturing” are inadequate to explain the process by which goods are produced in the modern world economy. For a large number of goods, physical production—activities such as stamping, molding, cutting, machining, welding, and assembly—is no longer the heart of the manufacturing process. The bulk of the value in many goods comes from activities such as design, product development, marketing, and distribution, which are not necessarily performed by the same enterprises, or at the same locations, as physical production.[26] The declining importance of physical production is in evidence in many countries, and is not a phenomenon limited to the United States.[27]
The shift to global supply chains has had both positive and negative effects on the U.S. economy. There is no doubt that it has contributed to reduced U.S. consumer prices for many manufactured products. The availability of imported intermediate inputs has probably preserved some manufacturing within the United States, as reliance on higher-cost domestic inputs might well make related U.S. final-goods manufacturing uncompetitive. Additionally, the supply chains themselves support U.S. jobs in transportation, logistics management, and other fields.
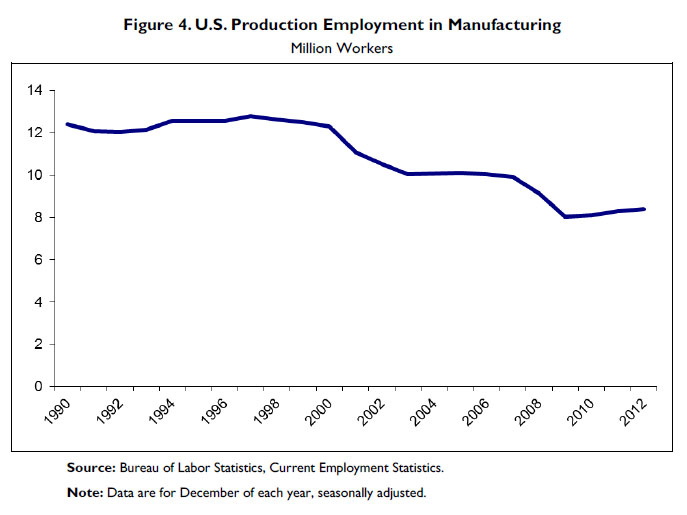
At the same time, there is widespread agreement that “offshoring” has played a major role in loss of factory production work (see Figure 4 ), leading to higher unemployment and reduced incomes for some groups of workers and some communities where import-sensitive manufacturing is located. Two recent studies estimate that the rapid growth of manufactured imports from China accounted for a quarter or more of the decline in U.S. manufacturing employment in the first decade of this century.[28]
The broader impact on the U.S. labor market, however, remains a matter of considerable debate. One recent study of the growth of Chinese exports to the European Union between 1999 and 2007, directly applicable to the United States, concludes that “trade drives out low-tech firms …and increases the incentives of incumbents to speed up technical change.”[29] This finding contradicts the many economic studies that attribute declining factory employment to technological change, as it emphasizes that the rate of technological change speeds up when trade with low-wage countries increases. It also suggests that declines in manufacturing production employment may go hand in hand with increased demand for workers with skills that are in some way related to goods production and distribution, but may not fall within the traditional definition of “manufacturing” work.
The transformation of manufacturing poses novel issues for public policies aimed at the manufacturing sector. A variety of federal programs, from the Hollings Manufacturing Extension Partnership administered by the National Institute of Standards and Technology [30] to the National Nanotechnology Initiative [31] to the Small Business Administration’s 504/CDC Loan Guaranty Program,[32] are designed, in part, to help manufacturers upgrade technology, replace capital stock, and compete more effectively in global markets. The extent to which such efforts lead private sector firms to select U.S. locations for high-value activities within their supply chains, and the degree to which those activities create employment, are unclear.
More broadly, shifts in the nature of value added in manufacturing put into question the efficacy of policies designed to promote factory production within the United States, such as tax policies favoring investment in manufacturing equipment and “Buy American” rules requiring certain goods financed by the federal government to be produced domestically. Given that employment and economic growth are increasingly decoupled from production, it is uncertain whether policies oriented to physical manufacturing activity are best suited to achieve desired economic goals.
Finally, the changes described in this report raise questions about the adequacy of government statistics. U.S. statistical agencies have made significant efforts in recent years to improve the collection of data on the service sector, corporate spending on research and development, and international trade in intangible products. Nonetheless, available data still tend to treat manufacturing and services as unrelated economic activities, and it is not clear that existing data series on domestic economic activity, trade, and freight transportation completely capture changes in the nature of manufacturing, the sources of employment, and the creation of value.
1 Industrial production and capacity data are published in the Federal Reserve Board’s monthly G.17 release, available at http://www.federalreserve.gov/releases/G17/Current/default.htm.
2 U.S. Bureau of Labor Statistics, “County Employment and Wages,” external pagehttp://www.bls.gov/cew, viewed April 9, 2013. Figure for September 2012 is preliminary.
3 For an explanation of this adjustment process, see Dave Wasshausen and Brent R. Moulton, “The Role of Hedonic Methods in Measuring Real GDP in the United States,” October 12-13, 2006, external pagehttp://www.bea.gov/papers/pdf/hedonicGDP.pdf.
4 Susan Houseman, Timothy Bartik, and Timothy Sturgeon, “Measuring Manufacturing: Problems of Interpretation and Biases in the U.S. Statistics,” working paper, February 2013. See also David Byrne, Brian K. Kovak, and Bryan Michaels, “Offshoring and Price Measurement in the Semiconductor Industry,” in Susan N. Houseman and Kenneth F. Ryder, eds., Measurement Issues Arising from the Growth of Globalization (Washington, DC: National Academy of Public Administration, 2010), pp. 169-194.
5 These estimates were calculated from BEA’s gross domestic product by industry tables and, for 2012, BEA’s prototype quarterly statistics on U.S. Gross Domestic Product by Industry, viewed April 10, 2013, at external pagehttp://www.bea.gov/industry/index.htm.
6 For discussion of this issue, see Robert E. Yuskavage, Eric H. Strassner, and Gabriel W. Medeiros, “Domestic Outsourcing and Imported Inputs in the U.S. Economy: Insights from Integrated Economic Accounts,” May 15, 2008, external pagehttp://www.bea.gov/papers/pdf/yuskavage_outsource.pdf, p. 40.
7 Jennifer Lee and Andrew G. Schmidt, “Research and Development Satellite Account Update,” Survey of Current Business , December 2010, pp. 16-27. For an exploration of some of the complexities arising from measurement of research and development, see Wendy C.Y. Li, “Depreciation of Business R&D Capital,” October 2012, external pagehttp://www.bea.gov/national/pdf/WendyLiDepreciationBusinessR&DCapital20130314BEAwebversion.pdf, and Carol Robbins, Olympia Belay, Matthew Donahoe, and Jennifer Lee, “Industry-level Output Price Indexes for R&D: An Input-cost Approach with R&D Productivity Adjustment,” December 10, 2012, external pagehttp://www.bea.gov/papers/pdf/industry_level_output_price_indexes_for_r_and_d.pdf.
8 Apple, Inc., Form 10-K for the fiscal year ended September 20, 2012, p. 12, states that “substantially all of the Company’s manufacturing is performed in whole or in part by a few outsourcing partners located primarily in Asia.” The only company-owned factory mentioned is in Cork, Ireland.
9 For details, see Maureen Doherty, “Reflecting Factoryless Goods Production in the U.S. Statistical System,” working paper, Bureau of Labor Statistics, March 2013.
10 Fariha Kamal, Brent R. Moulton, and Jennifer Ribarsky, “Measuring ‘Factoryless’ Manufacturing: Evidence from U.S. Surveys,” working paper, March 2013. On the justification for this change, see Office of Management and Budget, “North American Industry Classification System; Revision for 2012,” Federal Register vol. 76, no. 159, August 17, 2011, p. 51241, and U.S. Census Bureau, “Economic Classification Policy Committee (ECPC) Recommendation for Classification of Outsourcing in North American Industry Classification System (NAICS) Revisions for 2012,” May 12, 2010, external pagehttp://www.census.gov/eos/www/naics/fr2010/ECPC%20Recommendation%20for%20Classification%20of%20Outsourcing.doc.
11 Kimberly Bayard, David Byrne, and Dominic Smith, “The Scope of U.S. Factoryless Manufacturing,” working paper, February 28, 2013, estimate that the value of shipments in manufacturing would have been 7% to 30% higher than measured in the 2002 and 2007 Economic Censuses if “factoryless manufacturing” had been classified as manufacturing rather than wholesale trade. Their detailed analysis of the semiconductor industry finds that the sector’s value added would have been approximately 25% larger than measured in 2002 and 2007 if the output of companies that outsource production to a foreign contract manufacturer had been counted as manufacturing.
12 Susan N. Houseman, “Offshoring and Import Price Measurement,” Survey of Current Business, February 2011, pp. 7-11; Susan Houseman, Christopher Kurz, Paul Lengerman, and Benjamin Mandel, “Offshoring Bias in U.S. Manufacturing,” Journal of Economic Perspectives, vol. 25, no. 2 (Spring 2011), pp. 111-132.
13 CRS Report R40167, Globalized Supply Chains and U.S. Policy, by Dick K. Nanto. A growing academic literature examines global supply chains. Among the early examples is Gary Gereffi and Miguel Korzeniewicz, eds., Commodity Chains and Global Capitalism (Westport, CT: Greenwood Press, 1994).
14 On the challenges of measuring the use of intermediate imports, see Robert C. Feenstra and J. Bradford Jensen, “Evaluating Estimates of Materials Offshoring from U.S. Manufacturing,” National Bureau of Economic Research Working Paper 17916, March 2012.
15 Lucy P. Eldridge and Michael J. Harper, “Effects of imported intermediate inputs on productivity,” Monthly Labor Review , June 2006, pp. 6, 12.
16 OECD-WTO, Statistics on Trade in Value Added, (database) doi: 10.1787/data-00648-en, viewed April 10, 2013.
17 International Monetary Fund, “Changing Patterns of Global Trade,” p. 10, June 15, 2011, external pagehttp://www.imf.org/external/np/pp/eng/2011/061511.pdf.
18 Thomas H. Klier and James R. Rubenstein, “Imports of Intermediate Parts in the Auto Industry—A Case Study,” in Houseman and Ryder, eds., Measurement Issues Arising from the Growth of Globalization, pp. 226, 231.
19 Value added in the motor vehicle parts sector, which averaged 41.4% of shipments from 1997 through 2006, averaged only 36.8% of shipments from 2007 through 2011, according to Census Bureau data.
20 Calculated from OECD-WTO, Statistics on Trade in Value Added. For a similar calculation based on 2004 data, see Robert Koopman, William Powers, Zhi Wang, and Shang-Jin Wei, “Give Credit Where Credit Is Due: Tracing Value Added in Global Production Chains,” Working Paper 16426, National Bureau of Economic Research, September 2010, revised March 2011, external pagehttp://www.nber.org/papers/w16426.pdf.
21 Michael Ferrantino, Robert Koopman, Zhi Wang, Falan Yinug, Ling Chen, Fengjie Qu, and Haifeng Wang, “Classification and Statistical Reconciliation of Trade in Advanced Technology Products,” May 2008, external pagehttp://ssrn.com/abstract=1132748, pp. 38-43, 51. For a study reaching similar conclusions with respect to the sophistication of Chinese exports, see Mary Amiti and Caroline Freund, “The Anatomy of China’s Export Growth,” World Bank Development Research Group, Policy Research Working Paper 4628, May 2008, http://wwwwds.worldbank.org/external/default/main?pagePK=64193027&piPK=64187937&theSitePK=523679&menuPK=64187510&searchMenuPK=64187283&theSitePK=523679&entityID=000158349_20080527092730&searchMenuPK=64187283&theSitePK=523679.
22 Bureau of Economic Analysis, International Transactions, Table 3a.
23 Bureau of Economic Analysis, Detailed Statistics for cross-border trade, http://www.bea.gov/international/
international_services.htm, Table 4: Royalties and License Fees, viewed April 10, 2013.
24 The reported U.S. surplus in industrial process royalties equaled 1.2% of value added in U.S. manufacturing in 2011, but, as explained in the text, the reported value may not reflect transactions at market prices.
25 Services that seem likely to have been produced by U.S. manufacturers include industrial process licenses, research and development and testing services, operational leasing, industrial engineering, and installation, maintenance, and repair of equipment. Estimates of exports of services that may be related to manufacturing are included in Bureau of Economic Analysis, detailed statistics for cross-border trade, external pagehttp://www.bea.gov/international/international_services.htm, Tables 4 and 7.
26 See CRS Report R41898, Job Creation in the Manufacturing Revival, by Marc Levinson.
27 See CRS Report R42135, U.S. Manufacturing in International Perspective, by Marc Levinson.
28 Justin R. Pierce and Peter K. Schott, “The Surprisingly Swift Decline of U.S. Manufacturing Employment,” National Bureau of Economic Research working paper 18655, December 2012; David Autor, David Dorn, and Gordon H. Hanson, “The China Syndrome: Local Labor Market Effects of Import Competition in the United States,” National Bureau of Economic Research, working paper 18054, May 2012.
29 Nicholas Bloom, Mirko Draca, and John Van Reenen, “Trade Induced Technical Change? The Impact of Chinese Imports on Innovation, IT and Productivity,” National Bureau of Economic Research, Working Paper 16717, January 2011, p. 4.
30 CRS Report 97-104, Manufacturing Extension Partnership Program: An Overview, by Wendy H. Schacht.
31 CRS Report RL34401, The National Nanotechnology Initiative: Overview, Reauthorization, and Appropriations Issues, by John F. Sargent Jr.
32 CRS Report R41184, Small Business Administration 504/CDC Loan Guaranty Program, by Robert Jay Dilger.