Human Security Report 2012, Chapter 7: Non-State Armed Conflict
27 Dec 2012

Editor's Note: This week the ISN takes the opportunity to highlight the comprehensive and scholarly insights provided by the 2012 Human Security Report. In particular, we focus on Part II of the report ("Trends in Human Insecurity"), which traces the incidence and severity of armed conflicts and other forms of violence at the regional and global levels. (The forms of violence include state-based conflicts, persistent armed conflicts, non-state armed conflicts and deadly assaults on civilians.)
The particular virtue of the 2012 report is that it debunks the conventional wisdom on a number of significant points. Among its conclusions are that military interventions in appear to increase death tolls in civil wars; that peace negotiations are in fact highly effective; that conflicts between non-state actors and one-sided violence against civilians have not increased over the past two decades; and that the number of conflicts worldwide appears to be stabilizing, despite significant year-to-year fluctuations. You can find the full contents of the 2012 Human Security Report external pagehere, along with links to previous reports.
Our focus today is on Chapter 7 of the HSR, which notes that while there are now more non-state conflicts than state-based ones, they are on the whole far less deadly. (The number of non-state conflicts also tends to be stable and mostly located in Africa and Central and South America.) There are, however, significant gaps in the quality of available data on non-state armed conflicts, no doubt because deaths in such conflicts cannot be easily verified and thus tend to be underreported.
Chapter 7: Non-State Armed Conflict
A number of scholars and reports from international agencies have suggested that there has been a shift in the nature of warfare over the past two decades.99 According to this thesis, the traditional, state-centric view of armed conflict no longer accurately captures the forms of organized violence taking place today because non-state actors such as rebels, warlords, and communal groups are playing an increasingly important role.
Until recently, however, the only conflicts that were counted in datasets involved states fighting other states or armed non-state groups. This state-based conception of conflict captured much of the armed violence being waged around the world, but it left out an entire class of conflicts. This omission limited the scope of potentially useful quantitative research on armed conflict.
To remedy this, the Human Security Report Project (HSRP) asked the Uppsala Conflict Data Program (UCDP) in 2003 to collect data on non-state conflicts, defined by UCDP as those that involve “the use of armed force between two organized armed groups, neither of which is the government of a state, that results in at least 25 battle-related deaths in a year.”100
Initial data covering 2002 and 2003, presented in the 2005 Human Security Report, revealed that although there were more non-state conflicts in these years than state-based conflicts, the death tolls in non-state conflicts were, on average, much lower.
This report analyzes UCDP’s non-state data from 1989 to 2009, a period of 21 years, allowing us to trace developments since the end of the Cold War. The data show no real support for claims that non-state conflicts are becoming more widespread than state-based conflicts. The updated information reveals, instead, that non-state conflict numbers do not appear to be increasing overall, although they can fluctuate considerably from year to year. Conflicts among non-state actors tend to be much shorter than state-based conflicts. And the backdated data confirm our previous finding that these struggles are usually much less deadly than state-based conflicts: reported battle-deaths per year from the average non-state conflict between 1989 and 2009 were only about 16 percent of the battle death toll from the average state-based conflict during the same period. The data also reveal that there are considerable differences in the levels of organization of non-state groups involved in conflicts, and in the geographical concentration of these conflicts. Non-state conflicts and battle deaths have been most numerous in sub-Saharan Africa, followed by Central and South Asia. The other regions of the world have experienced comparatively few non-state conflicts.
What Is Non-State Armed Conflict?
As mentioned above, the UCDP non-state conflict data include only those conflicts that do not involve the government of a state as a party, and that—consistent with its treatment of data from other types of organized violence—result in 25 or more reported battle deaths in a calendar year.
UCDP codes numbers of conflicts and deaths according to clear and consistently applied definitions, thereby reducing the likelihood of double and incoherent counting. There will, however, always be a considerable amount of uncertainty in the battle-death counts. Estimating deaths from armed conflict is difficult as many deaths go unreported, especially in conflicts where international observers, NGOs (nongovernmental organizations), and the media are often absent. Non-state conflicts are particularly prone to under counting because they tend to erupt spontaneously and do not involve government forces, and draw less attention from journalists, governments, and NGOs than do state-based conflicts. To ensure that the data are comparable over time and across different countries, UCDP only includes those deaths and conflicts that coders are certain occurred.
Non-state groups involved in conflict have differing levels of organization. Some are highly organized, while in others organization is minimal and violence may be spontaneous. UCDP distinguishes among these non-state groups by categorizing them as either formally or informally organized. This distinction is discussed in the box, “Comparing Non-State Armed Groups.”
Most groups that are involved in non-state conflict are not involved in any other types of organized violence. However, about 13 percent have also taken part in state-based conflicts, fighting against national governments, and 10 percent of the groups have perpetrated one-sided violence against civilians (a category of organized violence that we discuss in the next chapter). About 6 percent have been involved in both types of violence. The latter groups include for example the Liberation Tigers of Tamil Eelam (LTTE) in Sri Lanka and the Ugandan rebel group Lord’s Resistance Army (LRA) in Sudan.
In rare cases, non-state conflicts cross international borders. Two non-state groups may fight in border areas, or on territory claimed by more than a single country. In 1995, for example, fighting between two rebel forces in Liberia spilled over into neighbouring Côte d’Ivoire. Throughout the 1990s and 2000s, sporadic fighting between rival ethnic groups erupted in an area joining Ethiopia, Sudan, and Kenya. Of the few non-state conflicts that have spanned two or more countries, most have occurred in sub-Saharan Africa, but some have also occurred in other regions.
Global and Regional Trends
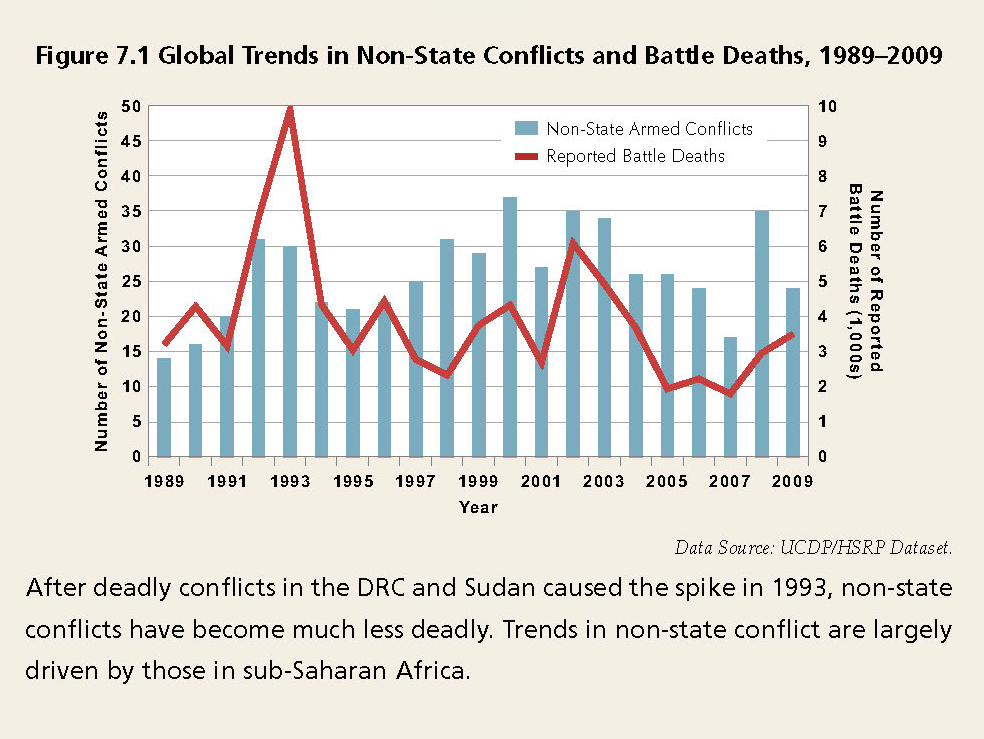
In this section we examine global trends in non-state conflicts during 1989 through 2009. During this period, 372 non-state conflicts in the world resulted in some 80,000 reported battle deaths. Numbers of non-state conflicts have fluctuated from year to year, as shown in Figure 7.1, but have not followed the same downward trend as state-based conflicts, which have declined substantially since the end of the Cold War. Because non-state conflicts tend both to erupt and to end quickly, year-to-year fluctuations in conflict numbers do not mean very much when analyzing long-term trends. Overall, there has been no clear upward or downward trend since the end of the Cold War.
Non-state conflicts, which were recorded as active in 1.5 calendar years on average, tend to be much shorter than the average conflict involving a state.102 As Figure 7.2 shows, the overwhelming majority of non-state conflicts during the period from 1989 to 2009 were active during only one year; many ended months, weeks, or just days after they began.

The longest-lasting non-state conflict in the dataset was found in Colombia. There, the two rebel forces, AUC and FARC, fought continuously for nine years from 1997 to 2005. Even though this conflict lasted an unusually long time, it was not nearly as deadly as most conflicts involving a state; it resulted in some 200 reported battle deaths per year on average. In the conflict between FARC and the Colombian government, which has lasted almost half a century, the violence recorded in the dataset between 1989 and 2009 was significantly more deadly. This state-based conflict led to an average 750 reported battle deaths per year for the 21 years of the conflict recorded by UCDP—meaning that it was almost four times deadlier than the fighting between FARC and AUC.
Although the number of non-state conflicts does not show the same post-Cold War decline as state-based conflicts, there is also no indication that they are becoming more numerous. And, as Figure 7.1 shows, the annual average death toll has declined in the second half of the period compared to the first half. The annual average death toll was around 4,400 each year on average between 1989 and 1999, but dropped by nearly 1,000 deaths in the new millennium. Moreover, the average non-state conflict tends to be much less deadly than the average conflict involving states. The average non-state conflict during the period studied, 1989 to 2009, caused some 150 reported battle deaths per year—much fewer than the 935 deaths per year from the average state-based conflict in the same period. Conflicts that involve a government are thus, on average, six times deadlier than conflicts that involve only non-state groups, according to this measure. Even if we assume that deaths from non-state conflict are less likely to be reported, the figures show that conflicts that involve a government appear to be many times deadlier than conflicts that involve only non-state groups.
11 of the 372 non-state conflicts during the period studied resulted in 1,000 or more reported battle deaths for at least one of the active years in the conflict. Most of these—nine of the 11—took place in sub-Saharan Africa. The other two were fought in India between 1989 and 1994, and in Burma in the early 1990s. Encouragingly, there have been fewer high intensity non-state conflicts since the mid-1990s than in the early years covered by the dataset, and none at all since 2005.
The non-state conflict that caused the highest total number of reported battle deaths in the dataset took place in the Democratic Republic of the Congo (DRC). From 1999 to 2003, the Hema and Lendu ethnic groups fought, causing some 6,000 reported battle deaths in total. While the two non-state groups fought one another, the DRC was also involved in a large scale civil war.
Many countries experiencing non-state conflict between 1989 and 2009 also experienced conflicts in which the state was a warring party—the DRC, above, is an example— even though, as we stated above, most groups that have fought in non-state conflicts were not involved in state-based conflicts. However, non-state conflicts also afflicted a few countries— Brazil, Jamaica, and Canada—that had experienced no state-based conflict since the end of World War II, although in none of these were very high numbers of battle deaths reported. All three of these conflicts involved criminal gangs. In Brazil in 2001, and again in 2004, for example, fighting erupted between rival criminal groups over control of gang territory, causing about 45 reported battle deaths per year on average. In 2001 fighting between supporters of opposing political groups in Jamaica, much of which was related to gang rivalry, caused 116 reported battle deaths in a single year. In Canada turf wars erupted between gangs for a few years in the 1990s, and generated approximately 30 reported battle deaths per year on average. In addition, Ghana, a country without any state-based conflict since 1983, experienced a deadly conflict between ethnic groups in 1994 that resulted in 2,000 reported battle deaths in a single year.
Figure 7.3 shows the trends in non-state conflict in the six regions of the world. Although non-state conflicts took place in every region during 1989–2009, they were most numerous in sub-Saharan Africa, which experienced an average of 18 non-state conflicts per year.
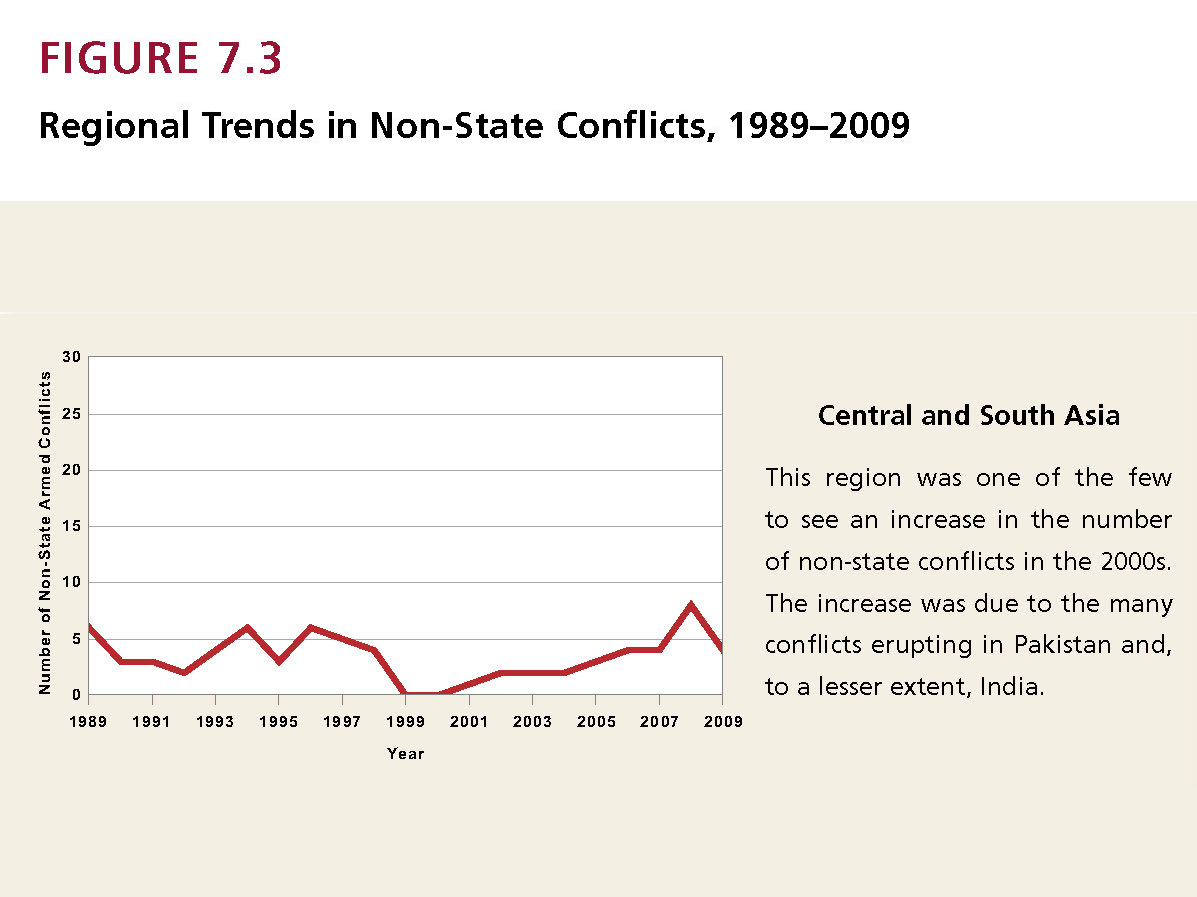
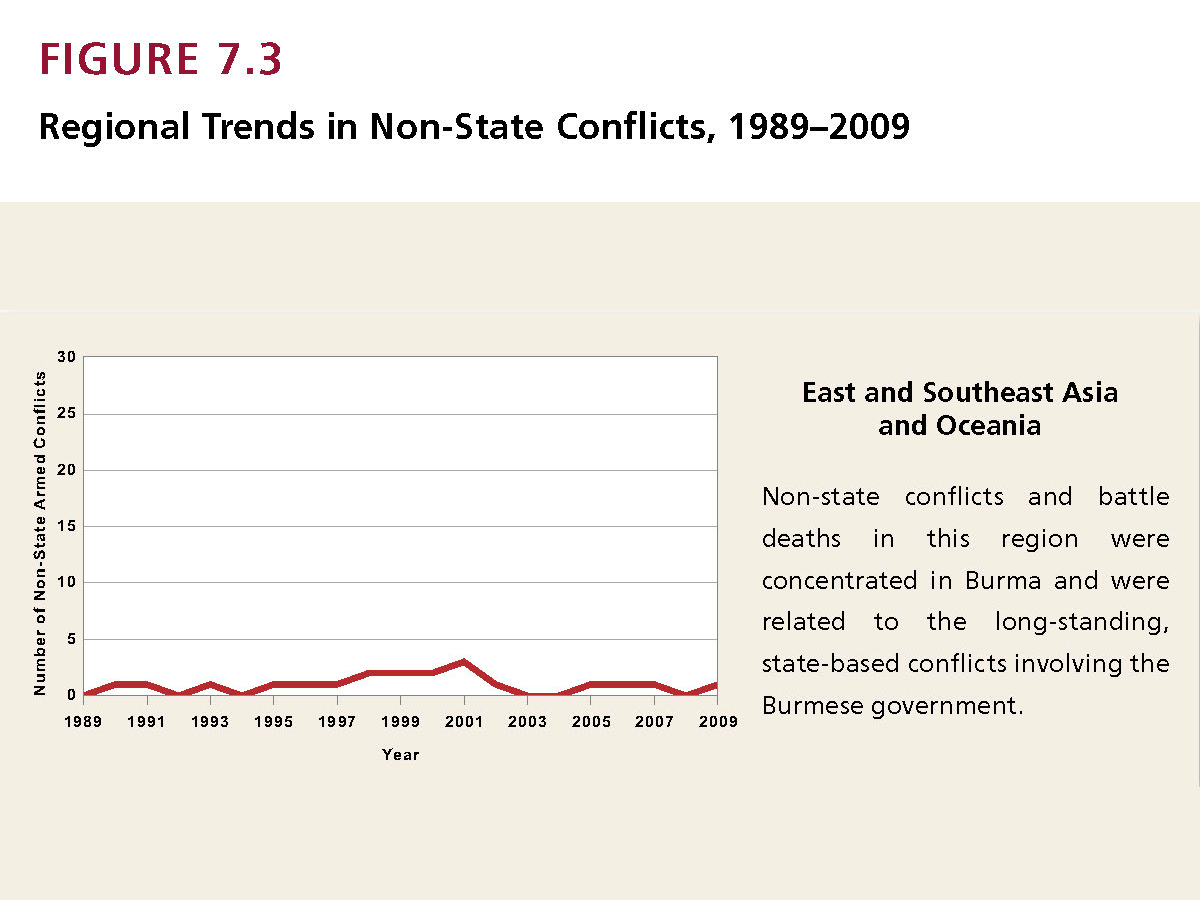
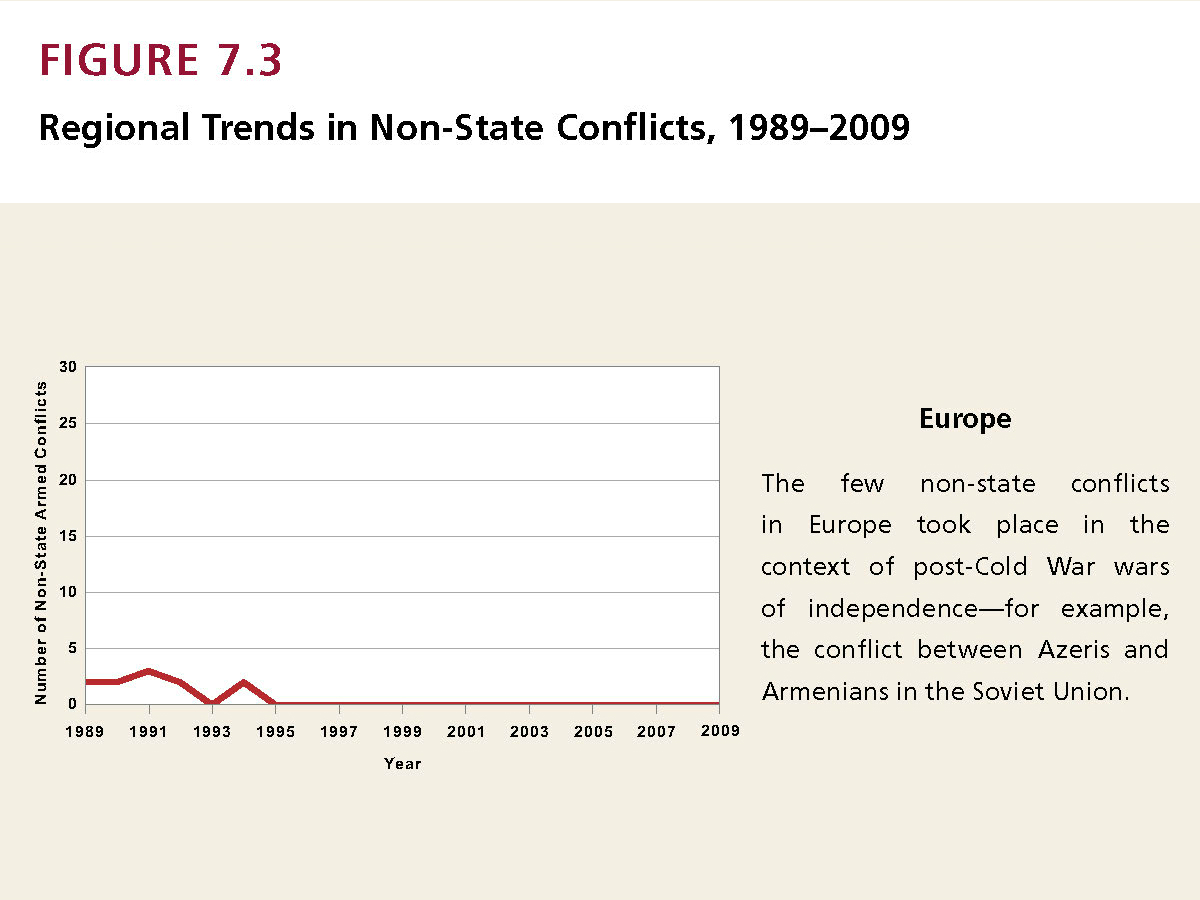
Central and South Asia was the region with the second-highest number of non-state conflicts, but it had just four non-state conflicts each year on average between 1989 and 2009. The Middle East and North Africa averaged fewer than two conflicts each year during the same period, followed by the Americas, with 1.5 conflicts each year on average. The region of East and Southeast Asia and Oceania averaged just over one conflict each year, while Europe, with the fewest each year, has been free of non-state conflict since the mid-1990s.
The difference between sub-Saharan Africa and the rest of the world is also reflected in reported battle-death tolls. Conflicts in sub-Saharan Africa accounted for the majority of the world’s battle deaths from non-state conflicts between 1989 and 2009. In 12 of the 21 years in that period—in other words, more than half the time—sub-Saharan Africa had more reported battle deaths than did Central and South Asia in its deadliest year.


Thus, we turn our focus now to sub-Saharan Africa, and then to Central and South Asia, the two regions that have suffered the highest number of non-state conflicts, as well as the highest number of battle deaths from non-state conflicts.
Sub-Saharan Africa
Figure 7.4 shows trends in non-state conflicts and battle deaths in sub-Saharan Africa between 1989 and 2009. During this period, 271 non-state conflicts in the region resulted in some 60,000 reported battle deaths.
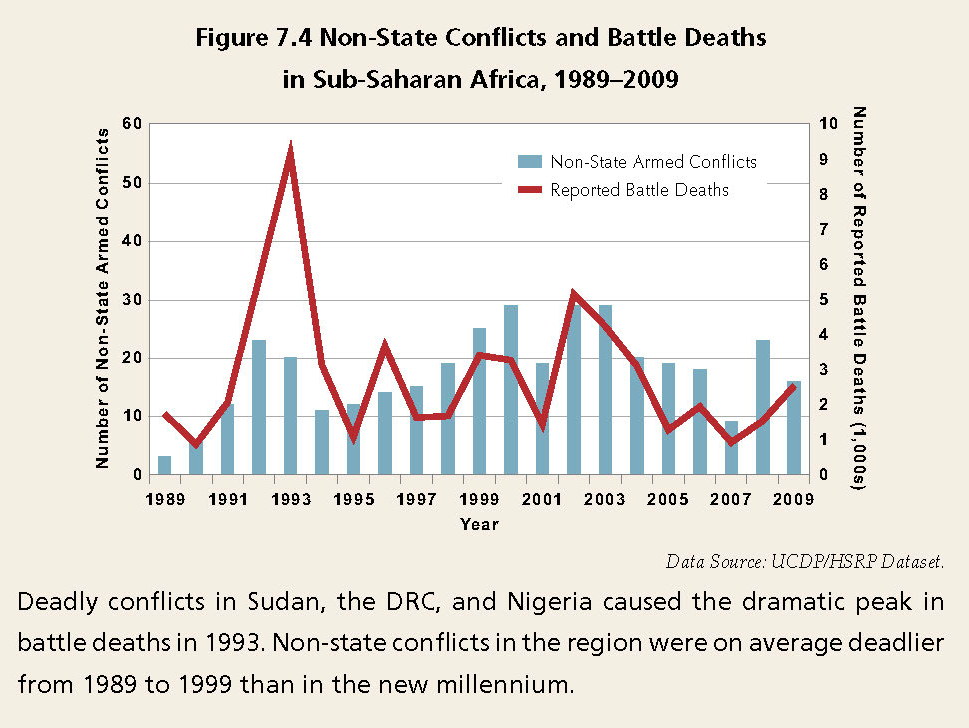
Within sub-Saharan Africa, most of the non-state conflicts were concentrated in three sub-regions: the Great Lakes, the Horn of Africa (defined here to include Sudan), and West Africa.
Somalia, Nigeria, Sudan, and Ethiopia experienced the most non-state conflicts of any countries in the world, while Sudan, the DRC, Somalia, and Nigeria experienced the highest numbers of reported battle deaths. Sudan alone, with less than 1 percent of the world’s population, has experienced nearly a fifth of all reported global battle deaths attributable to non-state conflicts. Many of the conflicts in Sudan were caused or exacerbated by its government’s deliberate strategy of weakening opposition groups by pitting them against one another.
Central and South Asia
Central and South Asia had the second-highest number of non-state conflicts during 1989–2009. In this region, 44 non-state conflicts caused some 8,000 reported battle deaths, as shown in Figure 7.5.
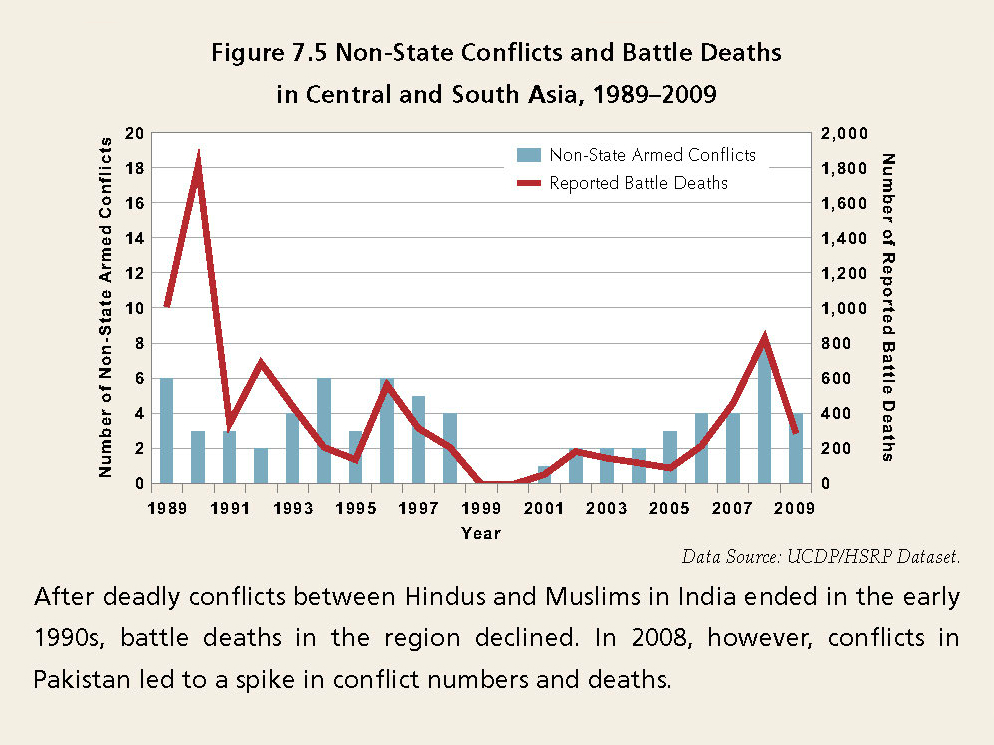
Over the period 1989–2004, Afghanistan recorded the highest number of non-state conflicts in the region—with a total of 21 different conflicts. Since then, most have been in Pakistan, which was the location for all four non-state conflicts in the region in 2009. Several of these involved conflicts between the Pakistan Taliban Movement and tribal armies in northwest Pakistan that had turned pro-government.
The deadliest year in the region for non-state conflicts during this period was 1990. Most non-state conflicts in Central and South Asia have killed relatively few people, but a single conflict––between Hindus and Muslims in India––was active every year from 1989 to 1994 and resulted in some 3,000 reported battle deaths. In 1990, the deadliest year of that conflict, fighting caused nearly 2,000 reported battle deaths, or 95 percent of the total in Central and South Asia in that year.
New Directions in Conflict Research
UCDP’s backdated non-state dataset for the years 1989-2009 creates opportunities for new research on conflicts between armed groups. In addition, UCDP has also geo-referenced the data on non-state conflicts, as well as on state-based conflicts and one-sided violence, in a new dataset. The data provide information on the location of deaths from non-state conflict and other forms of organized violence, a first version of which was released in December 2011 and covers sub-Saharan Africa. This section reviews some of the first studies to use the expanded non-state conflict data and the geo-referenced data on non-state conflicts, and suggests directions for future research.
The backdated and geo-referenced non-state datasets create new ways for researchers to test claims about factors that increase the risk of organized violence. This can be illustrated by the debate over the relationship between environmental factors and the onset of armed conflict.
Policy-makers and researchers devoted considerable attention to an argument made in 1994 by Robert Kaplan, and by others, that future wars would arise over environmental and resource disputes. However, there was little clear research-based evidence demonstrating how environmental degradation and resource scarcity would affect the risk of armed conflict. Since then, numerous studies have investigated the effect of environmental factors, focusing exclusively on state-based conflicts, but the results have been mixed. Now, it is possible to investigate correlations of environmental stresses with localized violence—such as nonstate conflict—using UCDP’s geo-referenced data. Since non-state conflicts tend to be very localized and often occur over land rights or other resources, they may be more influenced by changes in the environment.
Early findings from such research appear to support Kaplan’s argument that there is an association between environmental degradation and violent conflict. A 2011 study by Eric Melander and Ralph Sundberg found, for example, that acute soil degradation in areas of extreme population density in sub-Saharan Africa was strongly correlated with an increased risk of onset of non-state conflicts.
Similarly, in 2007 Ole Magnus Theisen and Kristian Brandsegg examined the association between localized changes in rainfall and conflicts arising in the same locations. They found that changing levels of precipitation were associated with a higher risk of non-state conflicts.
The geo-referenced data on non-state conflicts also allow researchers a new perspective on the impact of inequality on the risk of organized violence. Previous research has used national-level datasets to examine correlations between grievances—those associated with economic inequality, but also ethnic and religious divisions, and political repression—and the outbreak of state-based conflicts. Some of the most-cited earlier studies, including those by James Fearon and David Laitin, as well as Paul Collier and Anke Hoeffler, had failed to find any relationship between grievances and the outbreak of state-based conflict.
Again, the non-state data allow for new insights. In 2011 Hanne Fjelde and Gudrun Østby examined the impact of economic inequality between regions on the risk of non-state conflict in sub-Saharan Africa using UCDP’s geo-referenced data on non-state conflicts and Demographic Health Survey (DHS) data on subnational socio-economic welfare. They found that unequal access to economic benefits increased the likelihood that local groups would use violence against other groups. Rather than fighting the government—an approach requiring resources that these marginalized groups likely do not have—groups within these marginalized regions instead fight more privileged local groups for benefits.
Political instability can also increase the risk of non-state conflict. In a 2011 paper, Joakim Kreutz and Kristine Eck showed that during major regime transitions, it becomes more difficult to regulate the behaviour of groups. In a cross-national study, they found that regime transitions not only decrease the ability and willingness of the state to constrain violence between groups, but they also erode the legitimacy of in-group policing mechanisms. Moreover, this risk is more pronounced when the government in the previous period was authoritarian, led by an unconstrained executive, or dominated by a single ethnic group.
Much of the research thus far has focused on how non-state conflicts begin. How nonstate conflicts terminate is not well understood and has been little examined. Part of the reason is that such conflicts usually end quickly, they are small, and there is little involvement by national or international peacemaking interventions.
Another understudied area of non-state conflicts concerns a counterintuitive result that involves informally organized groups. Such groups generally lack the resources needed to fight effectively over long periods of time and are not permanently armed. Yet, some of the deadliest non-state conflicts between 1989 and 2009 were those fought between informally organized communal groups.
Although research on non-state conflicts is still new, use of UCDP’s backdated nonstate dataset and geo-referenced data have provided us with deeper insight into the distinct phenomenon of non-state conflict. As we point out above, non-state conflicts are much less destructive than their state-based counterparts. Nevertheless, the data that allow us to study this form of organized violence also contribute significantly to our understanding of issues left unclear by previous national-level research on state-based conflicts.
For additional reading on this topic please see:
Reasoning with Rebels
The Relevance of Private Actors in the Transnational Sphere for Just Peace Governance
Towards a Non-State Security Sector Reform Strategy