The SIPRI Top 100 Arms-Producing and Military Services Companies, 2014
30 Dec 2015
By Aude Fleurant, Sam Perlo-Freeman, Pieter D. Wezeman, Siemon T. Wezeman, Noel Kelly for SIPRI

This fact sheet was external pageoriginally published by the external pageStockholm International Peace Research Institute (SIPRI) in December 2015. It can also be accessed from our Digital Library.
The sales of arms and military services by the SIPRI Top 100—the world’s 100 largest arms-producing and military services companies (excluding China [1]), ranked by their arms sales—totalled $401 billion in 2014. This represents a decrease of 1.5 per cent compared to Top 100 revenues in 2013.[2] However, despite four consecutive years of decreasing sales, total arms revenues for the Top 100 companies in 2014 remained 43 per cent higher than for the Top 100 in 2002 (see figure 1).
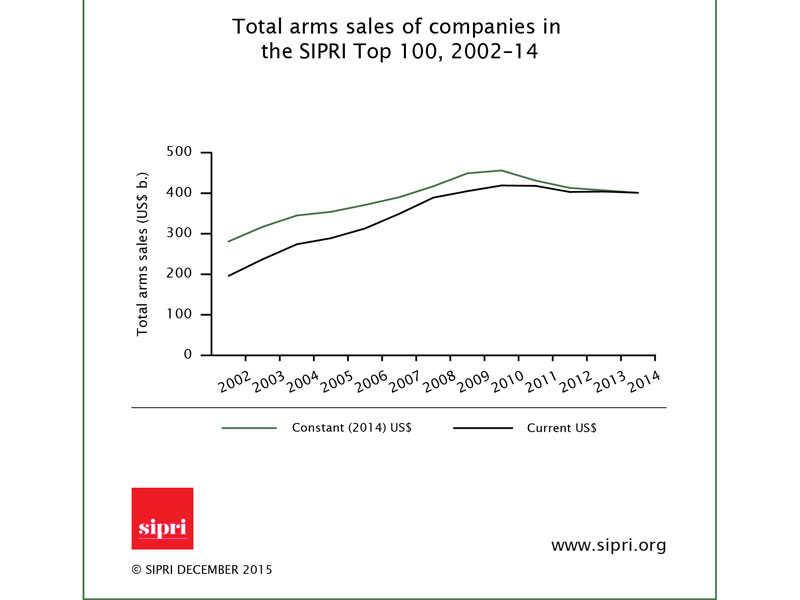
Figure 1: Total arms sales of companies in the SIPRI Top 100, 2002–14 (click to enlarge).
Notes : The data in this graph refers to the companies in the SIPRI Top 100 in each year, which means that it refers to a different set of companies each year, as ranked from a consistent set of data. ‘Arms sales’ refers to sales of military equipment and services to armed forces and ministries of defence worldwide. For a full definition see SIPRI Yearbook 2015.
DEVELOPMENTS IN THE TOP 100
Companies headquartered in the United States and Western Europe continue to dominate the global arms industry, with a share of 80.3 per cent of the Top 100 total arms revenues for 2014. This represents a fall of 3.2 percentage points compared to 2013. Fewer companies for the USA and Western Europe are ranked in the Top 100 for 2014: 64 compared to 67 in 2013. With a 7.4 per cent decrease in combined arms sales, the most significant falls in revenue are observable in Western European companies (26 per cent of the Top 100 revenues) reflecting the economic difficulties in the region. Of the nine Western European countries with companies ranked in the Top 100 in 2014, only two showed increases in their arms sales: Germany (9.4 per cent) and Switzerland (11.2 per cent) (see figure 2). For 2014, North America’s presence in the Top 100 comes exclusively from the 38 ranked US companies, which account for 54.4 per cent of total revenues (see figure 3).
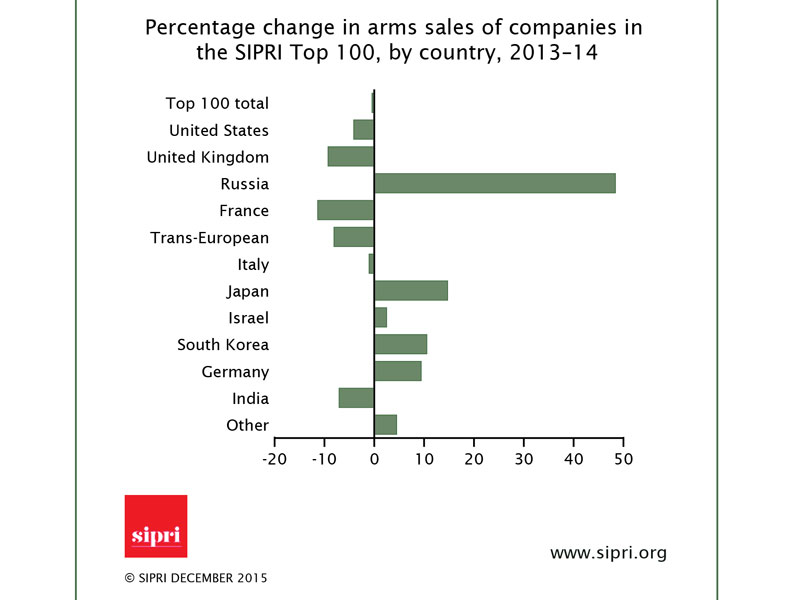
Figure 2: Percentage change in arms sales of companies in the SIPRI Top 100, by country, 2013–14 (click to enlarge).
Notes : The change refers to the companies in the Top 100 for 2014. The figures are based on arms sales in constant (2014) US$. The category ‘Other’ consists of countries whose companies’ arms sales comprise less than 1% of the total: Australia, Brazil, Finland, Norway, Poland, Singapore,Sweden, Switzerland, Turkey and Ukraine.
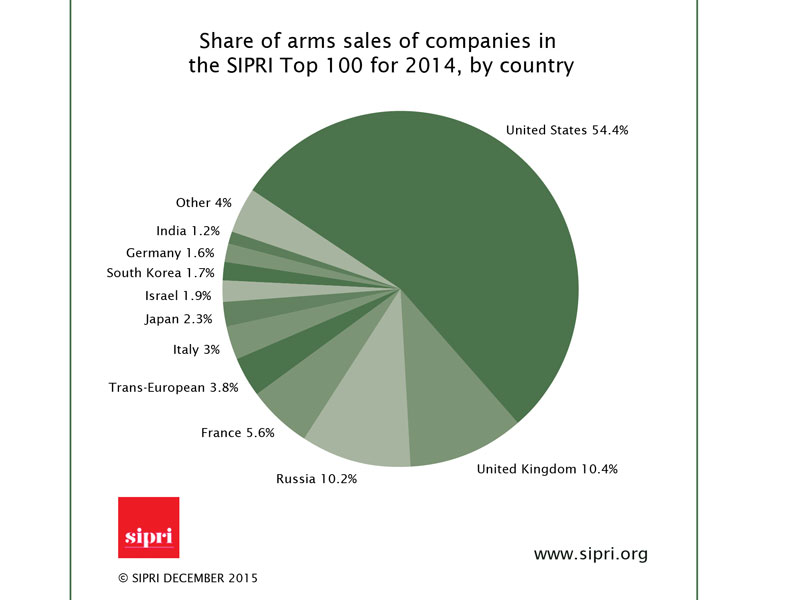
Figure 3: Share of arms sales of companies in the SIPRI Top 100 for 2014, by country (click to enlarge).
Notes : The Top 100 classifies companies according to the country in which they are headquartered, so sales by an overseas subsidiary will be counted towards the total for the parent company’s country. The Top 100 does not include the entire arms industry in each country covered, only the largest companies. The category ‘Other’ consists of countries whose companies’ arms sales comprise less than 1% of the total: Australia, Brazil, Finland, Norway, Poland, Singapore, Sweden, Switzerland, Turkey and Ukraine.
Despite deteriorating national economic conditions, Russian companies’ share of the Top 100 total revenues increased to 10.2 per cent of the Top 100, up from 7.6 per cent in 2013. Eleven Russian companies are now ranked in the SIPRI Top 100 compared to nine in 2013, with three companies entering the Top 100 in 2014 and one company— Sozvezdie—no longer featuring, following a merger to form United Instrument Manufacturing Corporation (UIMC). Other established arms-producing countries present in the Top 100, such as Australia, Israel, Japan, Poland, Singapore and Ukraine, make up 6 per cent of total revenues of the Top 100. Of these six, only Ukraine has shown a significant fall (–37.4 per cent) in real terms compared to 2013 revenues. Among the emerging producers (Brazil, India, South Korea and Turkey), 12 companies appear in the Top 100, accounting for 3.7 per cent of total arms revenues.
THE 10 LARGEST COMPANIES
All companies ranked in the Top 10 are based in the USA and Western Europe. Their combined turnover is 49.6 per cent of the total sales of the Top 100 in 2014, a slight fall from the 50.0 per cent share in 2013. US and Western European companies’ domination of the Top 100 will likely remain a characteristic of the global arms industry for the foreseeable future. However, regional trends since the 2008 economic crisis point to a modest but continuous weakening of this predominance, as companies based in other countries, such as Russia, benefit from substantial domestic spending.
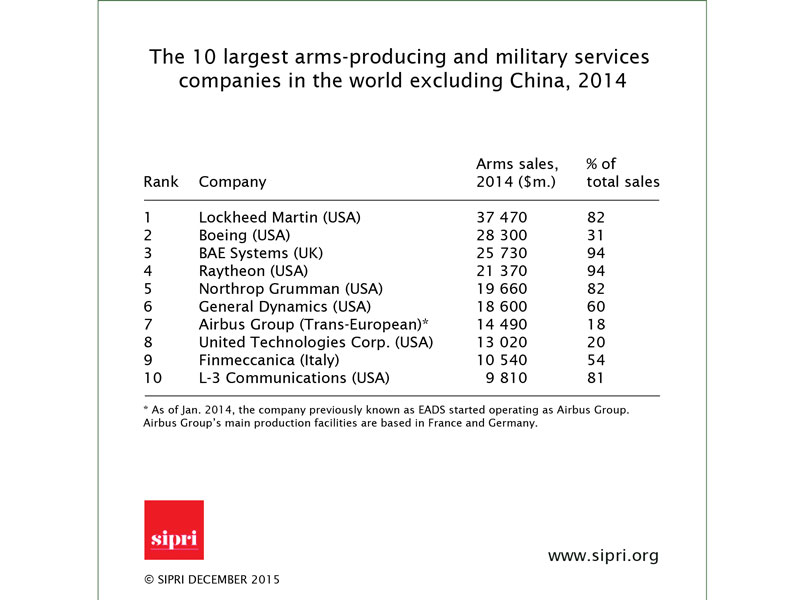
Figure 4: The 10 largest arms-producing and military services companies in the world excluding China, 2014 (click to enlarge)
Note: For the complete Top 100 list please refer to our Digital Library link to the SIPRI report provided at the top of this article.
NATIONAL DEVELOPMENTS
France, Germany and the United Kingdom Germany is one of the two Western European countries that have bucked the regional downward trend in arms sales, with a 9.4 per cent increase in 2014 compared to 2013. This is largely due to a rise of 29.5 per cent in 2014 in the arms sales of ship and submarine manufacturer ThyssenKrupp. In contrast, French companies’ arms sales decreased by 11.3 per cent in 2014, driven by the falling sales of combat aircraft manufacturer Dassault Aviation Groupe (–29.3 per cent) and Thales (–17.4 per cent). In 2014, the combined arms sales of the eight ranked companies based in the United Kingdom declined by 9.3 per cent compared to 2013 sales. The decrease can be clearly linked to reductions in military spending in the UK and the USA, the latter being an important market for almost all the ranked UK companies.
Russia
Eleven Russian companies are listed in the Top 100, of which eight were ranked in 2013. With a combined growth of 48.4 per cent, Russian companies substantially increased their arms sales between 2013 and 2014. Significant gains made by Russian arms companies can be attributed to high levels of Russian military spending and success in the export market. Three Russian companies—High Precision Systems, RTI and UIMC, are included in the Top 100 for the fi rst time. However, as sales figures for High Precision Systems were made available only in 2014, it is likely that this company would have been ranked in previous years.
The United States
US arms companies continue to account for the majority of arms sales of the Top 100, with 38 companies ranked—the same as in 2013—seven of which are in the Top 10. The US companies’ revenues represent 54.4 per cent of Top 100 total arms sales, down from a 55.5 per cent share in 2013. US companies’ arms sales decreased by 4.1 per cent between 2013 and 2014, a similar rate of decline as the one observed between 2012 and 2013. This decrease comes despite an easing of the limits imposed on federal spending in 2014 (a policy that continued in 2015) following an agreement in the US Congress. As was the case in 2013, the companies most affected by falling sales in 2014 were military services companies, such as Exelis (–38.4 per cent), and logistics and light armoured vehicles manufacturers, such as Oshkosh Corporation (–44.2 per cent). Lockheed Martin, which has occupied the first position of the Top 100 ranking since 2009, has increased its lead over its competitors with arms sales close to $37.5 billion, $27.7 billion more than the company ranked 10th (L-3 Communications). Lockheed Martin’s acquisition of helicopter manufacturer Sikorsky Aircraft in 2015 will likely bring the company’s turnover to over $40 billion, bolstering its position at the top.
ESTABLISHED AND EMERGING PRODUCERS
Poland and Ukraine
The major increase in arms sales for Poland is attributable to Polish Armaments Group, the country’s only ranking company in the Top 100. Polish Armaments Group has entered the Top 100 in 2014 due to a government-led process of consolidation of the majority of its arms production, maintenance and repair facilities into a single company. Polish Armaments Group is also benefiting from the increase in Polish military spending, which accelerated in 2015.
UkrOboronProm, a state-owned company that incorporates most of the Ukrainian arms industry, is the only Ukrainian company in the Top 100. It has fallen from 58th position in 2013 to 90th position in 2014, reflecting a decrease in sales of 50.2 per cent compared to 2013. A second Ukrainian company, Motor Sich, has dropped out of the Top 100 altogether. This can largely be explained by conflict-related factors in the country during 2014: a significant decrease in the local currency, which reduces the dollar value of the arms sales; direct disruption of production due to the conflict; the end of Russian–Ukrainian arms trade in mid-2014; and export problems.
Brazil, India, South Korea and Turkey
Collectively, countries included in the emerging producers category—Brazil, India, South Korea and Turkey—represent a small part of total Top 100 revenues. However, growth in their arms sales, as well as the long-term governmental goals of building national arms-production capabilities and increasing their presence in the export market, call for better tracking of their trajectory in the ranks of top arms producers. In 2014, 12 companies from emerging producers were ranked in the Top 100, accounting for 3.7 per cent of total arms revenues. Six South Korean companies are included in the 2014 Top 100 and their total arms sales increased 10.5 per cent in 2014 compared to 2013. Five were present in the 2013 Top 100. Hyundai Rotem entered the list in 2014 at rank 99. The rising sales are largely due to the continued growth in South Korea’s military spending, the pursuit of major procurement programmes and increases in exports. The growth in activity of South Korean companies in the 2014 Top 100 largely outpaced that of Indian companies, which were the dominant players in this category for 2013, but whose sales have been declining in 2014. There are now two Turkish companies among the 100 largest arms producers for the first time. From 2005 to 2014, ASELSAN’s arms sales trebled (215 per cent) in real terms and Turkish Aerospace Industries’ arms sales increased over elevenfold (1074 per cent). The Turkish arms industry benefits from high domestic demand for weapons as well as from strong support from the Turkish Government, which is seeking greater self-sufficiency in terms of arms supplies. Higher levels of arms exports have added to the growth in arms sales by Turkish companies.
Notes[1] Chinese companies are not covered by the SIPRI Top 100 due to the lack of data on which to make a reasonable estimate of arms sales for most companies. Nonetheless, some information is available on the 10 major state-owned conglomerates under which most of the Chinese arms industry is organized. Based on the overall industry picture and on limited information on individual companies, at least 9 of these 10 companies would almost certainly be in the Top 100 if figures for arms sales were available. Of these, 4 to 6 would probably be in the Top 20, and two—the aircraft producer AVIC and the land systems producer Norinco—may be in the Top 10. China’s military spending increased more than fivefold in real terms between 2000 and 2014 and the country has engaged in major efforts to develop its domestic industry. In addition, China’s arms exports have grown substantially in the past decade.
[2] All changes are in real terms unless otherwise specified. Figures do not always add up to totals because of the conventions of rounding.