Trends in International Arms Transfers, 2015
1 Mar 2016
By Aude Fleurant, Sam Perlo-Freeman, Pieter D. Wezeman, Siemon T. Wezeman for SIPRI
This paper was external pageoriginally publishedcall_made by the external pageStockholm International Peace Research Institute(SIPRI)call_made in February 2016.
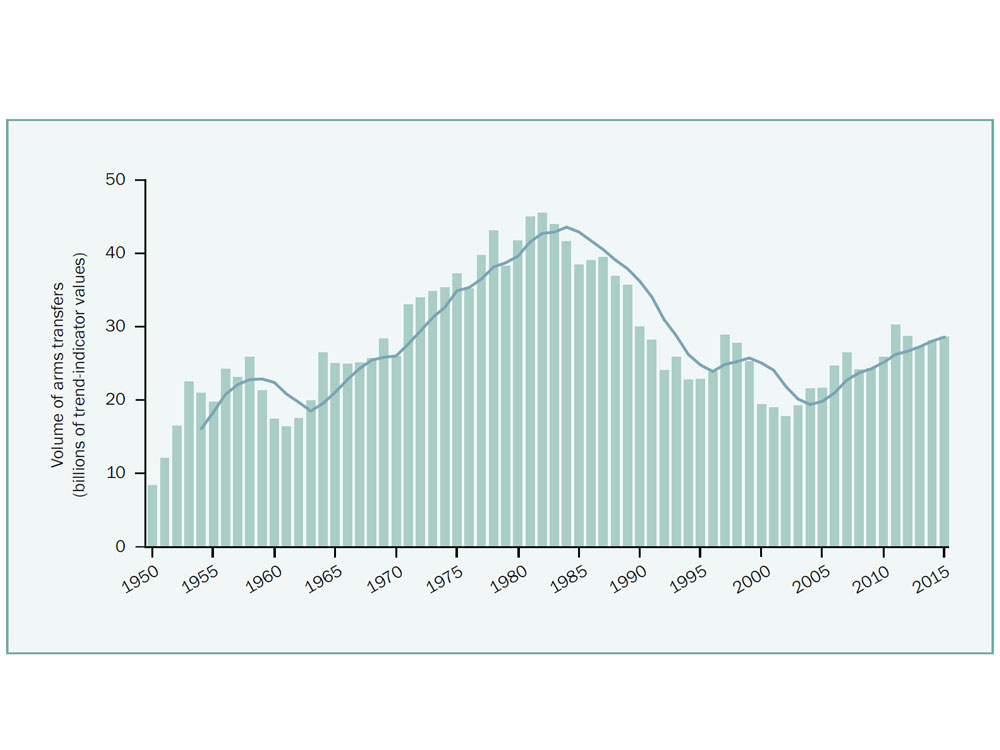
The volume of international transfers of major weapons in 2011–15 was 14 per cent higher than in 2006–10 (see figure 1). The five biggest exporters in 2011–15 were the United States, Russia, China, France and Germany, and the five biggest importers were India, Saudi Arabia, China, the United Arab Emirates (UAE) and Australia.
The flow of arms to Africa, Asia and Oceania and the Middle East increased between 2006–10 and 2011–15, while there was a sharp fall in the flow to Europe and a minor decrease in the flow to the Americas. The freely accessible SIPRI Arms Transfers Database was updated on 22 February 2016. It now includes new information on arms transfers in 2015 and updated information for 1950–2014.[1] This Fact Sheet highlights key trends and issues in arms transfers that are revealed by the new data. It lists the main exporters and importers in 2011–15 and describes the regional trends. As the volume of deliveries can fluctuate significantly year on year, SIPRI presents data for 5-year periods, giving a more stable measure of trends. Figures noted in this Fact Sheet do not always add up to a total of 100 per cent because of the conventions of rounding.
Figure 1: The trend in international transfers of major weapons, 1950–2015 (click to enlarge) [2]
THE EXPORTERS, 2011–15
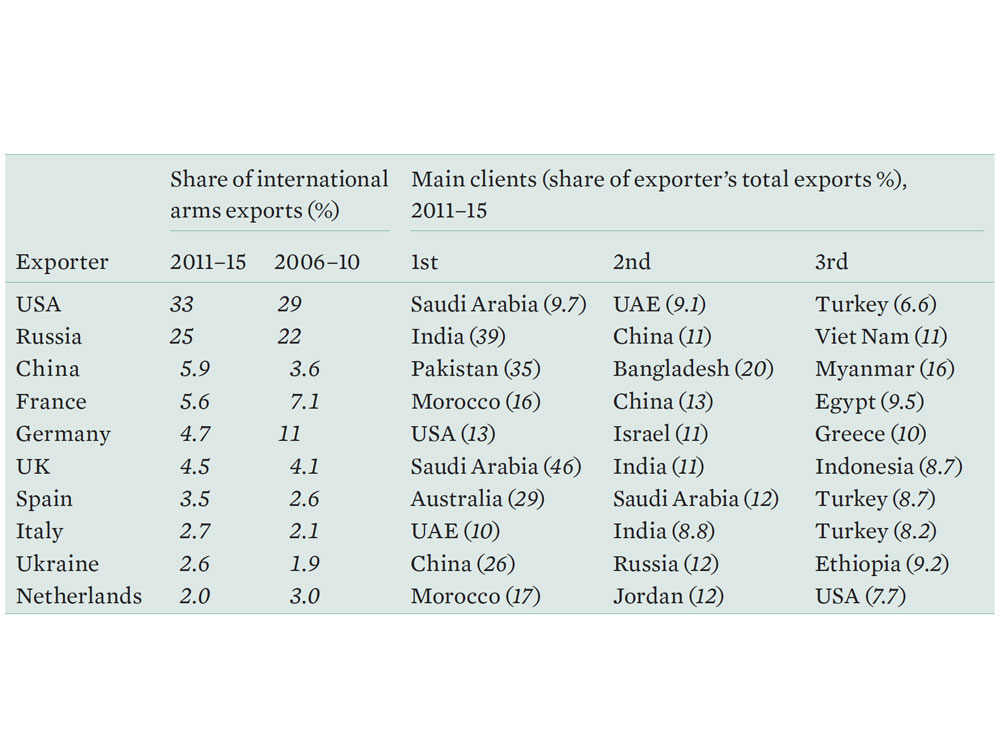
SIPRI has identified 58 countries as exporters of major weapons in 2011–15. The 5 largest sup pliers of arms during that period—the USA, Russia, China, France and Germany—were responsible for 74 per cent of all arms exports (see table 1). The composition and order of the top 5 suppliers changed between 2006–10 and 2011–15. While the USA and Russia remained by far the largest exporters, China’s arms exports increased from a level well below France, Germany and the United Kingdom to third position, just above France. The UK was the sixth-largest arms exporter in 2011–15. The top 5 exported 15 per cent more arms in 2011–15 than the top 5 in 2006–10.
Table 1: The 10 largest exporters of major weapons and their main clients, 2011–15 (click to enlarge) [3]
The United States
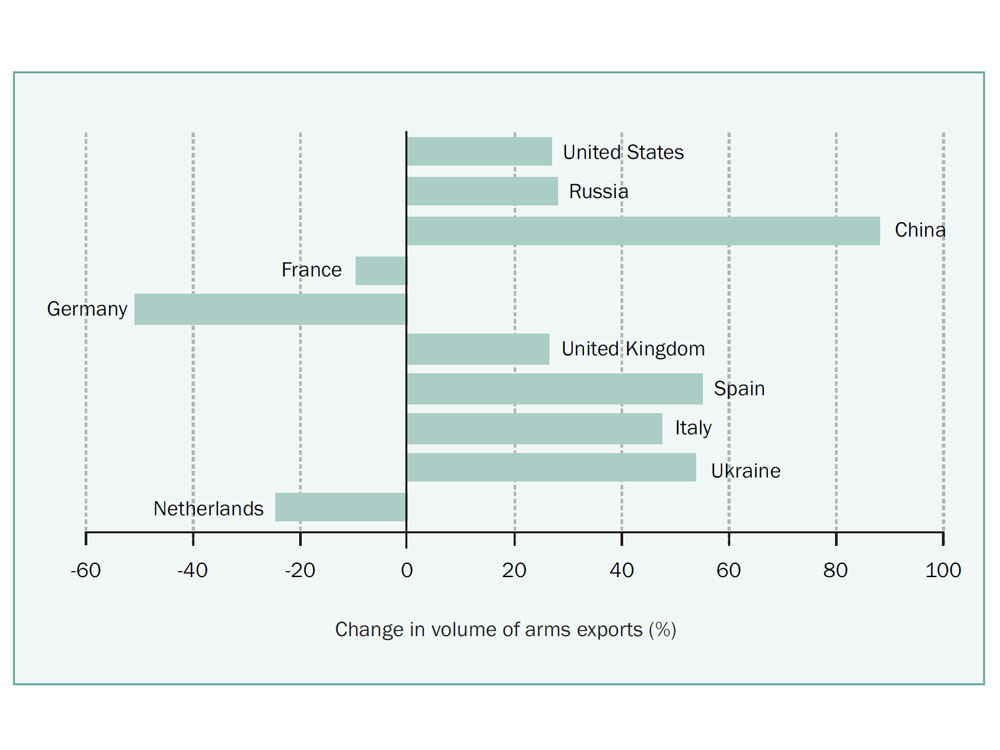
With a 33 per cent share of total arms exports, the USA was the top arms exporter in 2011–15. Its exports of major weapons increased by 27 per cent compared with 2006–10 (see figure 2). The USA delivered major weapons to at least 96 states in 2011–15, a significantly higher number of export destinations than any other supplier. The largest recipients were Saudi Arabia, accounting for 9.7 per cent of US arms exports, and the UAE with 9.1 per cent. At the regional level, the Middle East was the largest recipient of US weapons, accounting for 41 per cent of arms exports. Asia and Oceania received 40 per cent and Europe 9.9 per cent. Supplies of aircraft accounted for 59 per cent of the volume of US arms exports. As of the end of 2015, the USA had numerous outstanding large arms export contracts, including contracts to supply a total of 611 of its new generation F-35 combat aircraft to 9 states.
Russia
Russian exports of major weapons increased by 28 per cent between 2006–10 and 2011–15. However, exports in the years 2014 and 2015 were substantially lower than in 2011, 2012 and 2013, and were more in line with the levels seen in 2006–10. In 2011–15 Russia delivered weapons to 50 states and to rebel forces in Ukraine. Three states accounted for a significant proportion of Russia’s arms exports: India received 39 per cent, while China and Viet Nam each received 11 per cent. At the regional level, Asia and Oceania accounted for 68 per cent of Russian arms exports in 2011–15, Africa for 11 per cent, the Middle East for 8.2 per cent and Europe for 6.4 per cent. Supplies to Europe increased by 264 per cent, mainly due to deliveries to Azerbaijan, which in 2011–15 accounted for 4.9 per cent of all Russian exports as against 0.7 per cent in 2006–10.
China
Chinese exports of major arms increased by 88 per cent between 2006–10 and 2011–15, and China’s share of global arms exports rose from 3.6 to 5.9 per cent. China supplied major arms to 37 states in 2011–15, but the majority of these exports (75 per cent) were to states in Asia and Oceania. The rate of growth in Chinese arms exports was also most pronounced in that region: Chinese exports of major arms to states in Asia and Oceania in 2011–15 were 139 per cent higher than in 2006–10. Pakistan was the main recipient of Chinese exports, accounting for 35 per cent, followed by Bangladesh and Myanmar, accounting for 20 and 16 per cent respectively (all three states are neighbours of India, the leading importer of arms in the region).
Western European countries
The top five Western European suppliers—France, Germany, the UK, Spain and Italy—together accounted for 21 per cent of global arms transfers in 2011–15. French arms exports decreased by 9.8 per cent between 2006–10 and 2011–15. France exported arms to 78 states in 2011–15. A total of 28 per cent of French arms exports went to states in Asia and Oceania, 27 per cent to the Middle East, 18 per cent to Africa and 15 per cent to other states in Europe. France’s efforts to increase arms exports led to several major contracts in 2015, including the first two firm contracts for its Rafale combat aircraft, 24 each for Egypt and Qatar. Germany’s exports of major weapons decreased by 51 per cent between 2006–10 and 2011–15. Germany supplied major arms to 57 states in 2011–15. The main recipients were other European states (29 per cent). The next highest recipients at the regional level were the Americas, Asia and Oceania, and the Middle East—each receiving 23 per cent of Germany’s arms exports. Between 2006–10 and 2011–15 arms exports increased by 26 per cent for the UK, 55 per cent for Spain and 48 per cent for Italy.
THE IMPORTERS, 2011–15
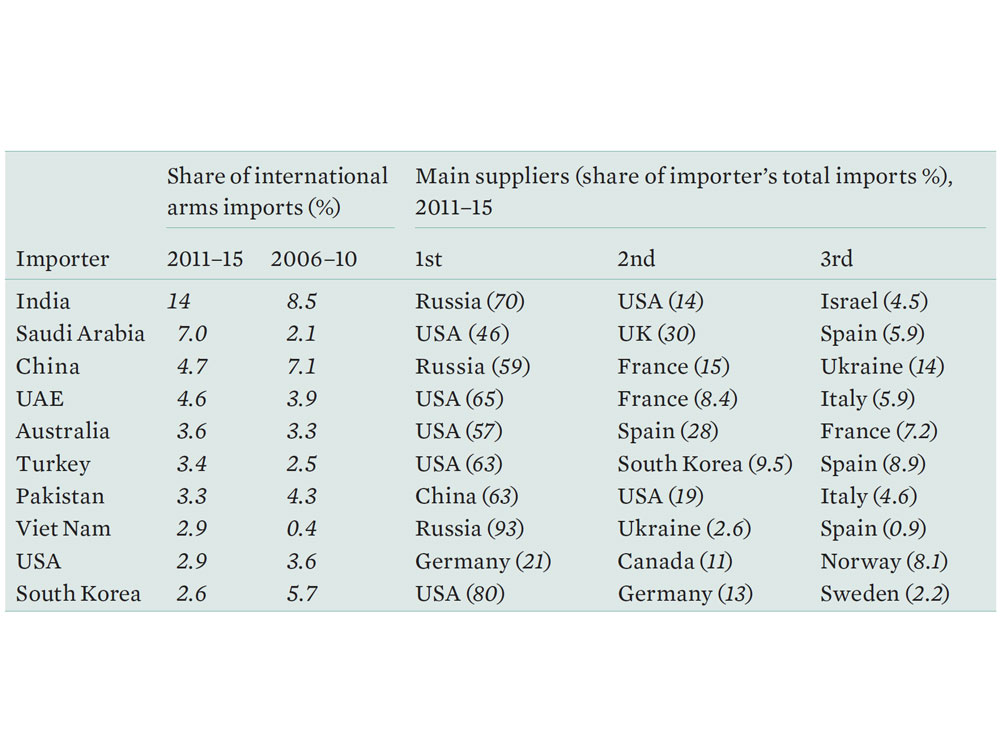
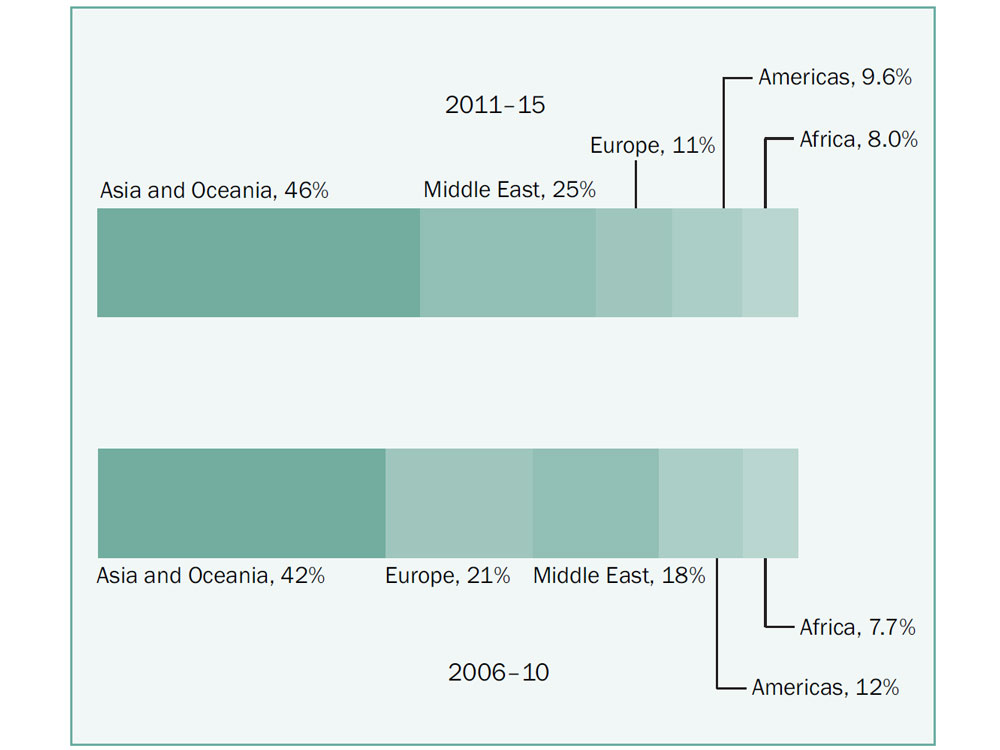
In 2011–15, 153 countries imported major weapons. The top 5 recipients— India, Saudi Arabia, China, the UAE and Australia—accounted for 34 per cent of the total arms imports during the period (see table 2). India, China and the UAE were among the top 5 importers in both 2006–10 and 2011–15. At the regional level, Asia and Oceania accounted for 46 per cent of imports in 2011–15, followed by the Middle East, Europe, the Americas and Africa (see figure 3). SIPRI also identified eight rebel forces as importers of major weapons in 2011–15, but none of these forces accounted for more than 0.02 per cent of total deliveries.
Figure 2: Changes in major arms exports since 2006–10 by the 10 largest exporters in 2011–15 (click to enlarge)
Table 2: The 10 largest importers of major weapons and their main suppliers, 2011–15 (click to enlarge) [4]
Africa
Between 2006–10 and 2011–15 imports by states in Africa increased by 19 per cent. The three largest importers in Africa in 2011–15 were Algeria (30 per cent of imports), Morocco (26 per cent) and Uganda (6.2 per cent). Russia accounted for 34 per cent of arms exports to the region, France for 13 per cent, China for 13 per cent and the USA for 11 per cent. States in sub-Saharan Africa received 41 per cent of total African imports. Uganda, Sudan and Nigeria were the largest importers in the subregion, accounting for 15, 12 and 11 per cent of the subregional total respectively. Russia accounted for 27 per cent of arms exports to the subregion and China for 22 per cent.
Algeria and Morocco
Algeria’s arms imports fell by 18 per cent in 2011–15 compared with 2006–10. However, under the known contracts, a number of significant deliveries are scheduled for the next five years, including 2 frigates from China, 2 frigates from Germany, and 190 tanks, 42 combat helicopters, 14 combat air craft and 2 submarines from Russia. Between 2006–10 and 2011–15 imports by Morocco increased by 528 per cent, although they remained below the level of Algerian arms imports. However, by the end of 2015 Morocco’s only large outstanding order for arms was for 150 tanks from the USA.
African states involved in armed conflict in West Africa
Most sub-Saharan African states import only small volumes of arms, despite the fact that many are involved in or close to armed conflicts. In 2015 Cameroon, Chad, Niger and Nigeria began a joint military campaign against Boko Haram. Their combined arms imports in 2011–15 accounted for 0.6 per cent of world arms imports. The combined total is 0.35 per cent if ships, which are not relevant to the campaign against Boko Haram, are excluded. Armed aircraft are a key military capability in this campaign. Imports of armed aircraft by the four states in 2011–15 included 1 second-hand, high-end combat aircraft, 8 secondhand ground-attack aircraft, 20 armed helicopters and 5 armed unmanned combat aerial vehicles (see box 1). Mali’s largest arms procurement since the outbreak of major armed conflict in the country in 2012 was an order placed in 2015 for six basic ground-attack aircraft from Brazil.
Figure 3: The importers of major weapons, by region, 2006–10 and 2011–15, per cent of global share (click to enlarge)
The Americas
Imports of major weapons by states in the Americas decreased by 6.0 per cent between 2006–10 and 2011–15. The USA was the largest importer of major weapons in the Americas in 2011–15. Arms imports by South American states fell by 19 per cent between 2006–10 and 2011–15. Russia accounted for 32 per cent of deliveries to South America, followed by the USA with 16 per cent and Germany with 10 per cent.
Venezuela and Brazil
Venezuela was the largest importer in South America during 2011–15. Its imports increased 13 per cent between 2006–10 and 2011–15. However, most of the deliveries in 2011–15 related to contracts signed before 2010, the great bulk of which were completed by 2013. Venezuela’s orders for weapons have fallen sharply in the past five years as a result of a severe economic crisis. In contrast, Brazil—the third largest importer in the Americas— is the only South American state with major outstanding orders for arms, including 36 combat aircraft from Sweden ordered in 2015 and 5 submarines from France. Brazil’s arms imports increased by 35 per cent between 2006–10 and 2011–15.
Mexico
Mexican arms imports increased by 331 per cent during 2011–15 compared with 2006–10. This significant increase is mainly connected to the Mexican Government’s war against drug cartels. Deliveries included a variety of transport aircraft, maritime patrol aircraft, basic ground-attack aircraft, armed helicopters, patrol boats and light armoured vehicles. The USA accounted for 52 per cent of deliveries to Mexico during 2011–15 (in many cases as military aid), followed by Spain with 19 per cent and France with 10 per cent. Asia and Oceania Arms imports by states in Asia and Oceania increased by 26 per cent between 2006–10 and 2011–15. States in the region received 46 per cent of global imports in 2011–15, up from 42 per cent in 2006–10. States in South Asia accounted for 44 per cent of the regional total, with North East Asia and South East Asia each accounting for 23 per cent, Oceania for 8.2 per cent and Central Asia for 2.3 per cent. Of the 10 largest importers in 2011–15, 6 were in Asia and Oceania: India, China, Australia, Pakistan, Viet Nam and South Korea.
India
India was the largest importer of major arms in 2011–15, accounting for 14 per cent of the global total. Between 2006–10 and 2011–15 imports increased by 90 per cent. In 2011–15 India’s imports were three times greater than those of either of its regional rivals: China and Pakistan. A major reason for the high level of imports is that India’s arms industry has so far largely failed to produce competitive indigenously designed weapons. In 2011–15 Russia supplied 70 per cent of India’s arms imports, the USA 14 per cent and Israel 4.5 per cent. The emergence of the USA as a major supplier to India is a recent development and US imports are growing; they were 11 times higher in 2011–15 than in 2006–10. However, based on existing orders and weapons, Russia will remain, by a significant distance, the main supplier of major arms to India for the foreseeable future.
China
China is increasingly capable of producing its own advanced weapons and has become less dependent on arms imports, which decreased by 25 per cent between 2006–10 and 2011–15. While in the early-2000s China was by far the largest importer, it dropped to third place in 2011–15. However, China remains partly dependent on imports for some key weapons and components, including large transport aircraft and helicopters, and engines for aircraft, vehicles and ships. Engines accounted for 30 per cent of China’s imports in 2011–15. In 2015 it signed orders for air defence systems and 24 combat aircraft from Russia, indicating that China is also not yet self-sufficient in those categories. China’s largest supplier was Russia, which accounted for 59 per cent of Chinese imports, followed by France with 15 per cent and Ukraine with 14 per cent.
Viet Nam
Viet Nam jumped from being the 43rd largest importer in 2006–10 to the eighth largest in 2011–15, with arms imports increasing by 699 per cent. This was the highest growth rate among the top 10 importers in 2011–15. Russia accounted for 93 per cent of the deliveries, which included 8 combat aircraft, 4 fast attack craft and 4 submarines armed with land-attack missiles. Viet Nam’s arms acquisitions (surface ships and submarines made up 44 per cent and aircraft 37 per cent of total acquisitions) are aimed at strengthening its capabilities in the South China Sea area, where its territorial claims collide with China’s. Additional weapons for maritime use are on order, including 6 frigates and 2 submarines (see box 2).
Europe
Imports by states in Europe decreased by 41 per cent between 2006–10 and 2011–15, with the region accounting for 11 per cent of total global imports. The fall is partly the result of economic pressures forcing states such as Greece and Spain to greatly reduce their arms purchases. Azerbaijan was the largest importer of major weapons in Europe, with deliveries increasing by 217 per cent between 2006–10 and 2011–15. The UK was the second-largest importer in Europe, despite a fall in imports of 17 per cent compared with 2006–10.
Greece
Deliveries to Greece in 2011–15 were down by 77 per cent compared with 2006–10. However, while Greece remained in deep economic crisis in 2015, its arms imports increased steeply that year due to the delivery of 2 submarines from Germany ordered in 2000. Greece’s submarine procurement is linked to its rivalry with Turkey, which has 6 submarines on order of the same type as Greece received in 2015.
Poland and the Baltic States
Poland’s arms imports fell by 65 per cent in 2011–15 compared with 2006–10. However, partly in reaction to Russia’s foreign policy, but also in line with previous armament plans, in 2013 Poland embarked on a major 10-year military modernization programme. As part of this programme, in 2015 it ordered long-range air-to-surface missiles from the USA and selected a US system to meet its air defence requirements.
Also linked to the perceived growing threat from Russia, Estonia, Latvia and Lithuania have started arms import programmes, albeit on a much smaller scale than Poland. All three are investing in armoured vehicles and shortrange air defence systems.
The Middle East
Arms imports by states in the Middle East increased by 61 per cent between 2006–10 and 2011–15. During 2011–15, 27 per cent of arms transfers to the region went to Saudi Arabia, 18 per cent to the UAE and 14 per cent to Turkey. The USA accounted for 53 per cent of total arms supplies to the region, the UK for 9.6 per cent and Russia for 8.2 per cent. Due to United Nations and other arms embargoes, Iran’s arms imports were at a very low level in 2011–15.
States intervening in Yemen
The military intervention in Yemen by a coalition of Arab states, which began in 2015, was facilitated by high levels of arms imports to several of the states leading the intervention. These states include Egypt, Qatar, Saudi Arabia and the UAE.
In 2011–15 Saudi Arabia’s arms imports increased by 275 per cent compared with 2006–10. Although concerns have been raised in arms-supplying states over Saudi air attacks in Yemen, Saudi Arabia is expected to continue to receive large numbers of major arms from those states in the next five years. Arms on order include 150 combat aircraft and thousands of air-to-surface missiles and anti-tank missiles from the USA, 14 combat aircraft from the UK and an undisclosed but large number of armoured vehicles from Canada with turrets from Belgium.
The UAE has continuously had high levels of arms imports since 2001. Its arms imports increased by 35 per cent between 2006–10 and 2011–15.
Qatari arms imports rose by 279 per cent between 2006–10 and 2011–15. These imports included the first deliveries of a number of large arms contracts that will substantially increase the size of Qatar’s military arsenal. Outstanding deliveries include 24 combat helicopters, 9 air defence systems and 3 airborne early warning aircraft from the USA, 24 combat aircraft from France and 52 tanks from Germany.
Arms imports by Egypt grew by 37 per cent between 2006–10 and 2011–15. Egyptian arms imports rose particularly steeply in 2015. The USA lifted a partial suspension of arms supplies to Egypt and delivered 12 combat aircraft, and France delivered a frigate within months of a deal being signed. In 2014 and 2015 Egypt signed a number of large deals for weapons from France, Germany and Russia.
Iraq
Arms imports by Iraq increased by 83 per cent between 2006–10 and 2011–15. Although the Islamic State captured or destroyed many weapons of the Iraqi armed forces in 2014, the flow of weapons to Iraq that started in 2003 continued in 2015. This included the supply of hundreds of armoured vehicles from the USA. Iraq’s air power increased significantly in 2014–15 with the delivery of 18 combat aircraft from the USA and 21 combat helicopters from Russia.
Annex 1
Transfers of combat aircraft and unmanned combat aerial vehicles
Combat aircraft of different sizes and capabilities are an important element of most states’ military arsenals. The market for new, high-end combat aircraft is strongly contested between a small group of suppliers. In 2011–15 a total of 555 newly produced or rebuilt advanced combat aircraft were exported from 7 supplying states. Of these, Russia exported 209 combat aircraft to 7 states, the United States exported 175 to 15 states, China exported 74 to 2 states, the United Kingdom exported 40 to 1 state, France exported 32 to 3 states, Sweden exported 23 to 2 states and South Korea exported 2 to 1 state. In addition, a total of 80 second-hand, high-end combat aircraft were exported.
Unmanned combat aerial vehicles (UCAVs) are increasingly being used in conflict, in particular by the USA. However, while interest in UCAVs is widespread, the number of UCAVs transferred in 2011–15 remained small compared to the number of combat aircraft. In 2011–15 China supplied 5 UCAVs to Nigeria and 4 to Iraq, while
the USA delivered 5 UCAVs to the UK. These UCAVs are far less capable in terms of range, payload and role compared to the high-end combat aircraft listed above.
Annex 2
Transfers of submarines
Submarine technology has developed significantly in recent years. Many submarines now have underwater endurance lasting several weeks and are equipped with long-range anti-ship missiles and torpedoes, and land-attack missiles. These capabilities increase their effectiveness as area-denial weapons and allow for stealth attacks on land targets.
Between 2006 and 2015 the growing and highly competitive export market for submarines was completely dominated by China, France, Germany, Russia, South Korea and Sweden. However, they were joined by Japan in 2015 when it submitted a bid to an Australian tender for 12 submarines. The United States and the United Kingdom currently produce only nuclear-propelled submarines, which they do not offer for export.
In 2011–15, 16 submarines were exported. Germany supplied 3 submarines to Greece, 2 each to Colombia and Israel, and 1 each to Italy and South Korea. Russia supplied 4 submarines to Viet Nam and 1 to India, while Sweden supplied 2 to Singapore. As of the end of 2015 a total of 48 submarines were on order in export deals. Germany is to deliver 6 to Turkey, 5 to South Korea, 4 to Egypt, 2 to Singapore and 1 each to Greece, Israel and Italy. Russia is scheduled to transfer 2 each to Algeria and Viet Nam. France is to deliver 6 to India and 5 to Brazil. China is scheduled to transfer 8 to Pakistan and 2 to Bangladesh, while South Korea is to deliver 3 to Indonesia.
Notes
[1] The SIPRI Arms Transfers Database contains information, often estimates, on all international transfers of major weapons (including sales, gifts and production under licence) to states, international organizations and armed non-state groups since 1950. It is the only publicly available resource providing consistent data on arms transfers for this length of time. The database aims to support efforts to better understand the effects of arms flows on peace, stability and violent conflict. The database is accessible at .
[2] Note : The bar graph shows annual totals and the line graph shows the 5-year moving average (each data point in the line graph represents an average for the preceding 5-year period). The SIPRI trend-indicator value (TIV) is a measure of the volume of international transfers of major weapons. The method used to calculate the SIPRI TIV is described on the SIPRI website at .
[3] Note : Percentage of total is rounded to 1 decimal (except for percentages over 10 which are rounded to whole numbers).
[4] Note : Percentage of total is rounded to 1 decimal (except for percentages over 10 which are rounded to whole numbers).


