Trends in International Arms Transfers, 2016
2 Mar 2017
By Aude Fleurant, Pieter Wezeman, Siemon Wezeman and Nan Tian for Stockholm International Peace Research Institute (SIPRI)

This article was external pageoriginally published by the external pageStockholm International Peace Research Institute (SIPRI) in February 2017.
Key Facts
- Transfers of major weapons in 2012–16 reached their highest volume for any five-year period since the end of the cold war.
- The volume of transfers of major weapons in 2012–16 was 8.4 per cent higher than in 2007–11.
- The five biggest exporters in 2012–16 were the USA, Russia, China, France and Germany. Together, they accounted for 74 per cent of the total volume of arms exports.
- Combined, the USA and Russia supplied 56 per cent of all exports.
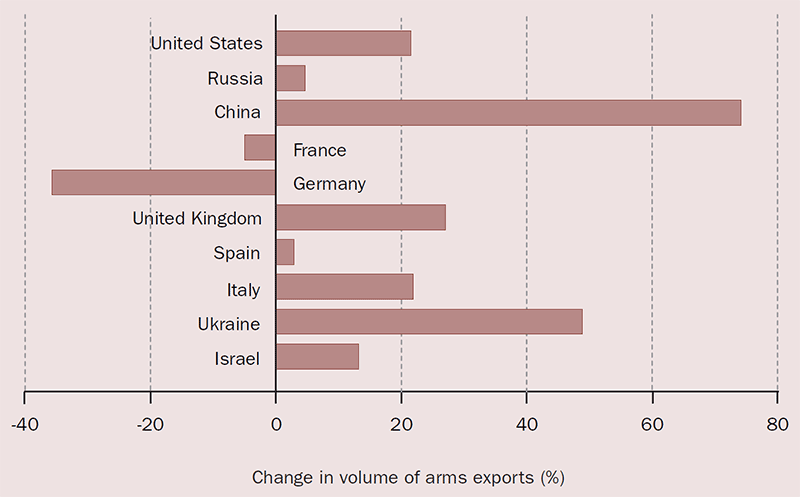
- US, Russian and Chinese arms exports in 2012–16 were higher than in 2007–11 with respective increases of 21, 4.7 and 74 per cent.
- German arms exports decreased by 36 per cent between 2007–11 and 2012–16, and French exports fell by 5 per cent.
- The five biggest importers in 2012–16 were India, Saudi Arabia, UAE, China and Algeria. Together, they received 34 per cent of all arms imports.
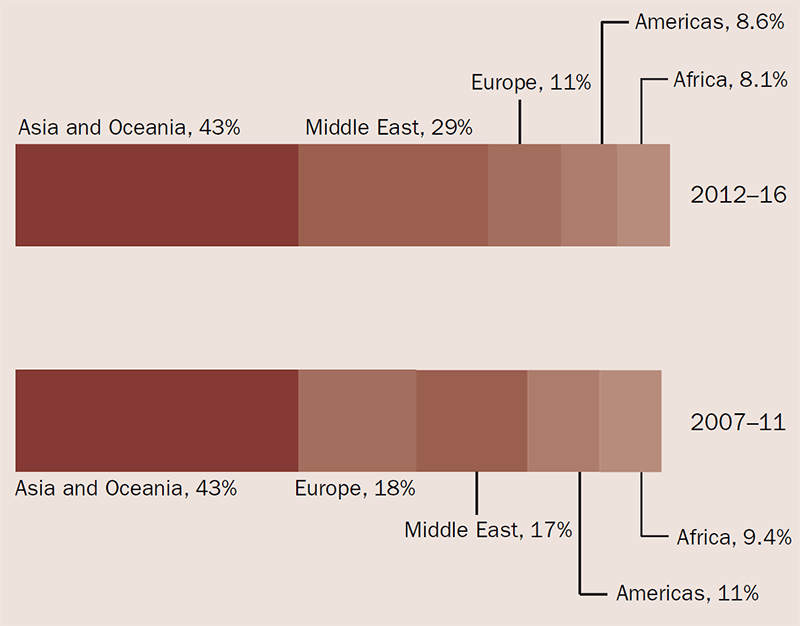
- The main recipient region in 2012–16 was Asia and Oceania (accounting for 43 per cent of global imports), followed by the Middle East (29 per cent), Europe (11 per cent), the Americas (8.6 per cent) and Africa (8.1 per cent).
- Between 2007–11 and 2012–16, arms imports by states in Asia and Oceania increased by 7.7 per cent and the Middle East by 86 per cent. Imports by states in Europe fell by 36 per cent, the Americas by 18 per cent and Africa by 6.6 per cent.
The volume of international transfers of major weapons in 2012–16 was 8.4 per cent higher than in 2007–11 (see figure 1). This was the highest volume for any five-year period since 1990. The five biggest exporters in 2012–16 were the United States, Russia, China, France and Germany, by rank. The five biggest importers were India, Saudi Arabia, the United Arab Emirates (UAE), China and Algeria. The flow of arms to Asia and Oceania and the Middle East increased between 2007–11 and 2012–16, while there was a decrease in the flow to Europe, the Americas and Africa.
From 20 February 2017 the freely accessible SIPRI Arms Transfers Database includes data on arms transfers in 2016 and updated information for 1950–2015.1 Based on the new data this Fact Sheet highlights some of the key global and regional trends and issues in arms transfers. Readers are encouraged to explore the Arms Transfers database to investigate further global, regional or national arms transfer developments. As the volume of deliveries can fluctuate significantly year-on-year, SIPRI presents data for five-year periods, giving a more stable measure of trends. Figures presented in this Fact Sheet may not always add up to stated totals because of the conventions of rounding.
Figure 1. The trend in international transfers of major weapons, 1950–2016
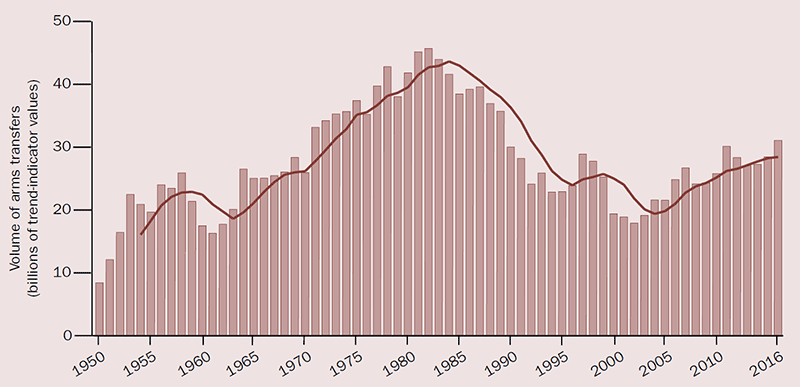
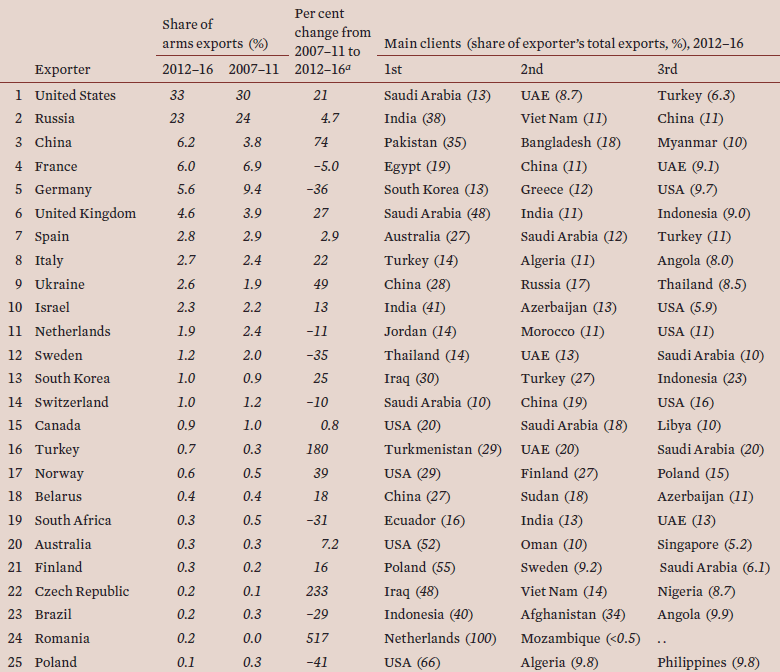
Table 1. The 25 largest exporters of major weapons and their main clients, 2012–16
The Exporters, 2012-2016
SIPRI has identified 57 countries as exporters of major weapons in 2012–16. The five largest suppliers of arms during that period—the USA, Russia, China, France and Germany—were responsible for 74 per cent of all arms exports (see table 1). The largest arms exporters in 2007–11 were the USA, Russia, Germany, France and the United Kingdom. The top five in 2012–16 exported 8.5 per cent more arms than the countries comprising the top five in 2007–11.
The United States
With a 33 per cent share of total arms exports, the USA was the top arms exporter in 2012–16, compared with 30 per cent in 2007–11 (see figure 2). Its exports of major weapons increased by 21 per cent compared with 2007–11 (see figure 3). At the regional level, the Middle East was the largest recipient of US weapons, accounting for 47 per cent of US arms exports. Asia and Oceania received 35 per cent, Europe 10 per cent and Africa 2.3 per cent.
The USA delivered major weapons to at least 100 states in 2012–16, a significantly higher number of export destinations than any other supplier. The largest recipient was Saudi Arabia accounting for 13 per cent of US arms exports. The flow of weapons to Saudi Arabia from the USA is likely to remain high due to deliveries of 154 F-15SA combat aircraft, which began in 2016. This is despite calls in the US Congress during 2016 for restrictions on arms supplies to Saudi Arabia in response to Saudi military operations in Yemen, many causing civilian casualties.
The USA also increased its exports of missile defence systems during 2012–16. Japan, Kuwait, Poland, Qatar, South Korea, Saudi Arabia, Taiwan and the UAE received, ordered or selected the Patriot PAC-3 system. In 2015–16 the UAE was the first export destination for the THAAD systems, the most advanced US missile defence system available.
Figure 2. Global share of major arms exports by the 10 largest exporters, 2012–16
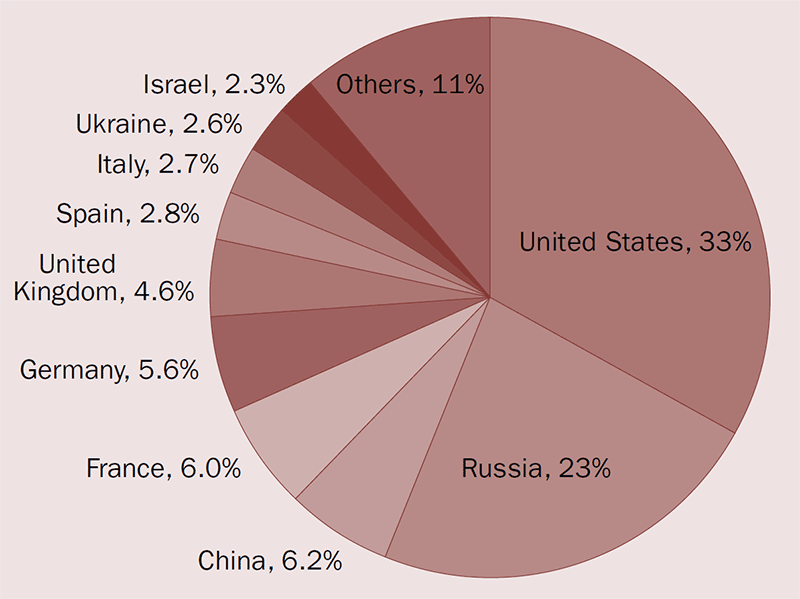
Figure 3. Changes in volume of major arms exports since 2007–11 by the 10 largest exporters in 2012–16
Box 1. Transfers to rebel groups
Six rebel groups are among the 165 identified recipients of major weapons in 2012–16. While together deliveries to these six groups accounted for no more than around 0.02 per cent of the global volume of transfers of major arms, they play an important role in actual conflicts.
Rebels in eastern Ukraine received tanks and other armoured vehicles as well as anti-tank and portable surface-to-air (SAM) missiles from Russia. Both Hamas and the Popular Resistance Committees in Gaza (Palestine) received anti-tank missiles—most likely from North Korea, but possibly delivered via Iran, Sudan or Egypt.
Rebels in Syria received anti-tank missiles and portable SAMs. The Palestinian Islamic Jihad in Palestine received anti-tank missiles. The Kurdistan Workers' Party (Partiya Karkerên Kurdistanê, PKK) in Turkey received portable SAMs. For these three cases, the suppliers are not identified with a satisfactory level of certainty.
There are a number of reasons why it is difficult to find hard evidence of arms supplies to rebels, to estimate the numbers of weapons supplied and to identify the supplier. In addition to secrecy and propaganda, other factors also contribute. For instance, the unclear structure of many rebel forces and their factions may make it difficult to determine, with an acceptable level of certainty, which of several rebel groups have acquired specific weapons and how they were sourced. A further complication is that the weapons often used by rebels are the same or similar to weapons used by government forces and may well be captured from them instead of supplied from outside.
Russia
Russian exports of major weapons increased by 4.7 per cent between 2007–11 and 2012–16. While deliveries in 2016 were higher than in 2014 and 2015, the volume remained substantially below the peak years 2011–13 and were more in line with the levels seen in 2007–10. At the regional level, Asia and Oceania accounted for 68 per cent of Russian arms exports in 2012–16, Africa for 12 per cent, the Middle East for 8.1 per cent and Europe for 5.9 per cent.
During 2012–16 Russia delivered weapons to 50 states and to rebel forces in Ukraine. The bulk of Russian arms exports went to a comparatively small group of states: India accounted for 38 per cent, Viet Nam and China each for 11 per cent and Algeria for 10 per cent. Azerbaijan and Venezuela were also important recipients accounting for 4 and 5 per cent of Russian exports; however, no Russian arms deliveries have been identified to either in 2016.
China
Chinese exports of major arms increased by 74 per cent between 2007–11 and 2012–16, and China’s share of global arms exports rose from 3.8 to 6.2 per cent. At the regional level, the majority of Chinese exports went to Asia and Oceania (71 per cent), followed by Africa (22 per cent) and the Middle East (1.7 per cent).
Chinese arms exports to states in Africa grew the most, in 2012–16 they were 122 per cent higher than in 2007–11. Overall the geographic spread and number of recipients increased. In 2007–11 China delivered major arms to 38 countries, and in 2012–16 it exported to 44 countries. In 2012–16, China delivered major arms for the first time to ex-Soviet states. One example in 2016 was the delivery of surface-to-air missile (SAM) systems to Turkmenistan.
West European countries
The top five West European suppliers—France, Germany, the UK, Spain and Italy—together accounted for 21.7 per cent of global arms transfers in 2012–16.
French arms exports decreased by 5 per cent between 2007–11 and 2012–16. A total of 38 per cent of French arms exports went to states in the Middle East, 29 per cent to Asia and Oceania, 11 per cent to the Americas, 9.2 per cent to Africa and 12.8 per cent to other states in Europe. France delivered major arms to 81 states in 2012–16. In this same period, several large arms export deals were agreed, including 12 submarines for Australia, 6 frigates for Malaysia and 5 for Egypt, 36 combat aircraft for India and 24 combat aircraft each for Egypt and Qatar.
Germany’s exports of major arms decreased by 36 per cent between 2007–11 and 2012–16, even though exports in 2016 peaked at a similar level as the annual average for 2007–11 when Germany was the third-largest arms exporter. A total of 28 per cent of German arms exports went to other states in Europe, 24 per cent to states in Asia and Oceania, 23 per cent to the Middle East, 16 per cent to the Americas and 8.9 per cent to Africa. Germany delivered major arms to 60 states in 2012–16.
Between 2007–11 and 2012–16 British arms exports increased by 27 per cent. However, China’s increase in arms exports pushed the UK from its position as the fifth-largest exporter in 2007–11 to sixth in 2012–16. Arms exports increased 2.9 per cent for Spain and 22 per cent for Italy. The combined arms exports by European Union (EU) member states accounted for 26 per cent of the global total in 2012–16, a 9.8 per cent decrease compared with 2007–11.
Figure 4. The importers of major weapons, by region, 2012–16 and 2007–11, per cent of global share
The Importers, 2012-2016
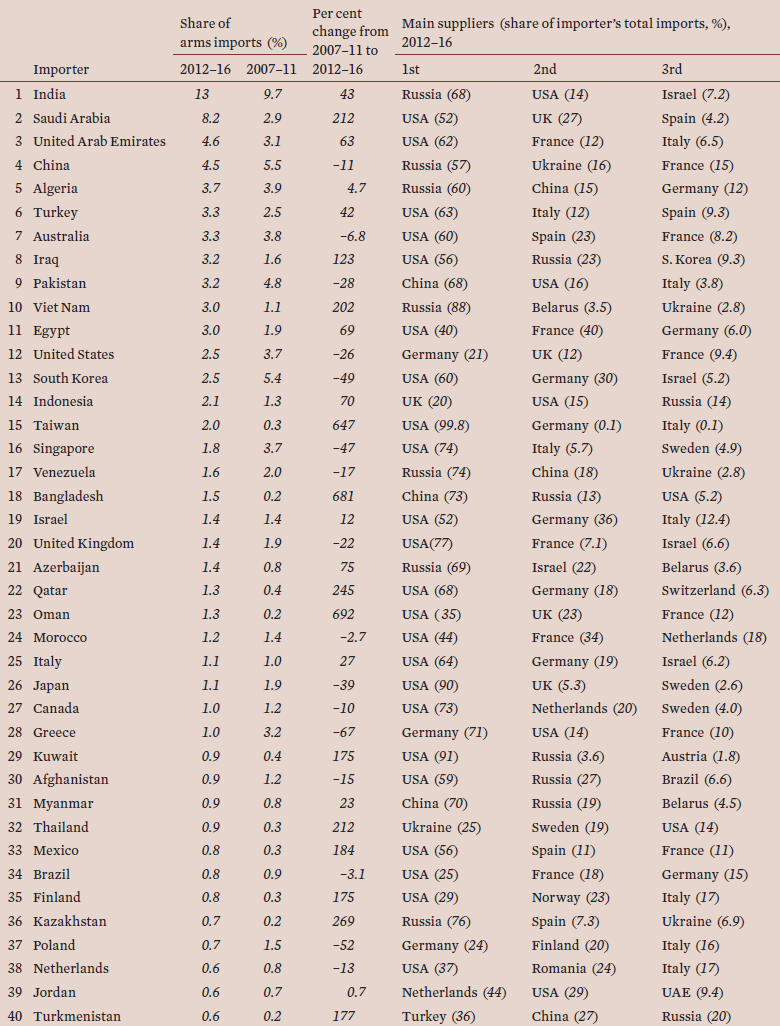
In 2012–16, 155 countries imported major weapons. The top five recipients—India, Saudi Arabia, the UAE, China and Algeria—accounted for 34 per cent of the total arms imports during the period (see table 2). Of these, India, China and Algeria were among the top five importers in both 2007–11 and 2012–16. At the regional level, Asia and Oceania accounted for 43 per cent of imports in 2012–16, followed by the Middle East, Europe, the Americas and Africa (see figure 4). SIPRI also identified small volumes of major arms transfers to six rebel groups in 2012–16 (see box 1).
Africa
Between 2007–11 and 2012–16, imports by African states decreased by 6.6 per cent. The three largest importers in Africa in 2012–16 were Algeria (46 per cent of imports), Morocco (15 per cent) and Nigeria (4.6 per cent). Russia was the largest supplier of arms to Africa, accounting for 35 per cent of arms exports to the region, followed by China for 17 per cent, USA for 9.6 per cent and France for 6.9 per cent.
States in sub-Saharan Africa received 35 per cent of total African imports. Nigeria, Sudan and Ethiopia were the largest importers in the subregion, accounting for 13, 12 and 9.8 per cent of the subregional total, respectively. China accounted for 27 per cent of arms exports in the subregion, Russia for 19 per cent and Ukraine for 18 per cent.
Algeria
Algeria’s arms imports increased by 4.7 per cent in 2012–16 compared with 2007–11. Russia accounted for 60 per cent of Algerian arms imports, China for 15 per cent and Germany for 12 per cent. Algerian arms imports rose steeply in 2016, accounting for 54 per cent of all its imports during the period 2012–16. Imports in 2016 included 2 frigates from Germany, 2 frigates from China and 8 combat aircraft and 180 tanks from Russia.
Conflict regions and top arms importers in sub-Saharan Africa
In 2012–16 the top five arms importers in sub-Saharan Africa were Nigeria, Sudan, Ethiopia, Cameroon and Tanzania. Together they accounted for 48 per cent of arms imports in the subregion. Four of these states are involved in armed conflicts. Fighting with Boko Haram is directly related to arms imports in Nigeria and Cameroon. The fighting in Darfur and in South Sudan, involving Sudan, coincided with sustained levels of high arms imports by Sudan. Ethiopia, which has ongoing tensions with Eritrea, is fighting al‑Shabab rebels in Somalia and has used major arms against anti-government protests.
Table 2. The 40 largest importers of major weapons and their main suppliers, 2012–16
The Americas
Imports of major weapons by states in the Americas decreased by 18 per cent between 2007–11 and 2012–16. The USA was the largest importer of major weapons in the region in 2012–16. Arms imports by the South American subregion accounted for 46 per cent of those by the Americas. They fell by 30 per cent between 2007–11 and 2012–16. Venezuela was the largest importer in South America during 2012–16. However, the country has been hit hard by falling oil prices and in 2016 its arms imports were only 1.7 per cent of the total for 2012–16. Russia accounted for 34 per cent of deliveries to South America, followed by the USA with 16 per cent and France with 8.1 per cent.
Colombia and Mexico
Colombian arms imports decreased by 19 per cent during 2012–16 compared with 2007–11. The decline occurred as the peace process with Revolutionary Armed Forces of Colombia (Fuerzas Armadas Revolucionarias de Colombia, FARC) rebel forces gained momentum. As drug-related violence surged in Mexico, imports of major arms increased 184 per cent between 2007–11 and 2012–16. The USA was the main major arms supplier to both Colombia and Mexico in 2012–16, accounting for 39 per cent and 78 per cent of their respective total deliveries.
Figure 5. Global share of major arms imports by the 10 largest importers, 2012–16
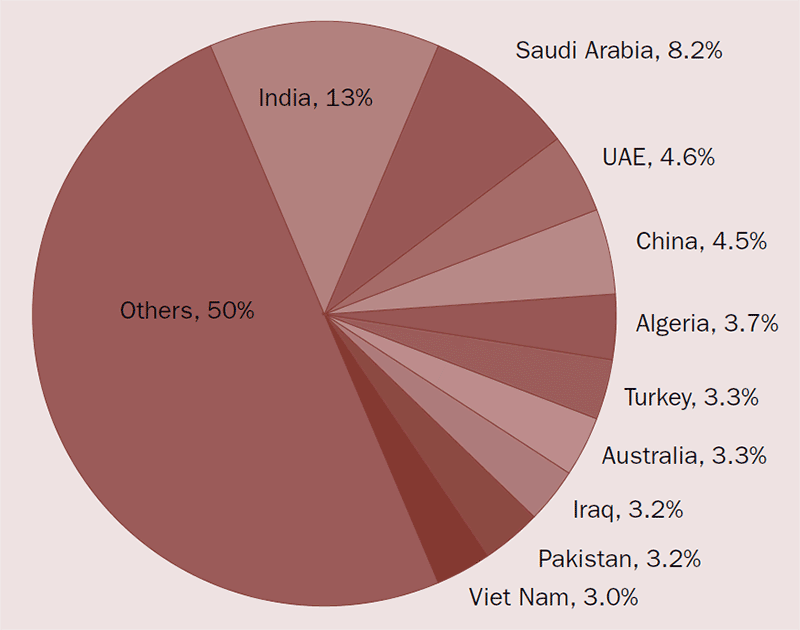
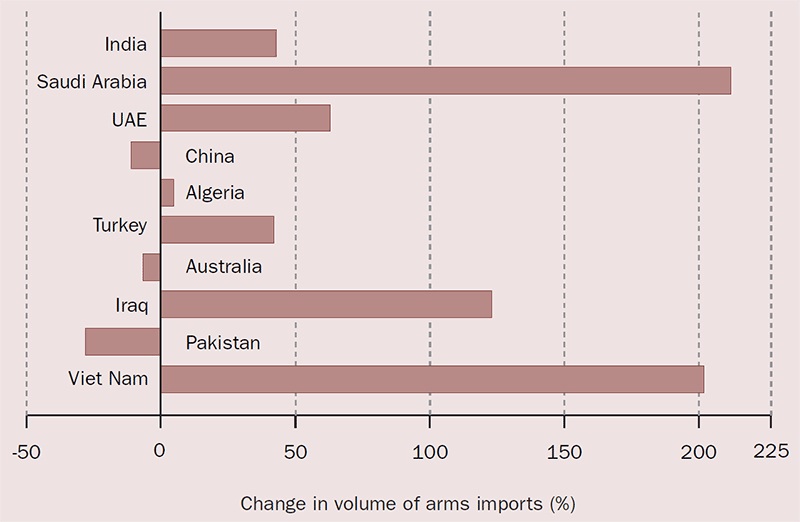
Figure 6. Changes in volume of major arms imports since 2007–11 by the 10 largest importers in 2012–16
Asia and Oceania
Arms imports by states in Asia and Oceania increased by 7.7 per cent between 2007–11 and 2012–16. States in the region received 43 per cent of global imports in 2012–16, the same as in 2007–11. States in South Asia accounted for 43 per cent of the regional total, North East Asia for 24 per cent, South East Asia for 22 per cent, Oceania for 7.9 per cent and Central Asia for 3.3 per cent. Of the 10 largest importers in 2012–16, half were in Asia and Oceania: India, China, Australia, Pakistan and Viet Nam. Russia accounted for 37 per cent of deliveries to Asia and Oceania, followed by the USA with 27 per cent and China with 10 per cent.
South East Asia
Tensions between several countries with maritime claims in the South China Sea have directly or indirectly driven up demand for major weapons in this subregion. Imports by countries in South East Asia increased 6.2 per cent from 2007–11 to 2012–16. Most of the weapons acquired in this subregion— including frigates, submarines, support ships, combat aircraft and anti-ship weapons—have a maritime role. Viet Nam jumped from being the 29th largest importer in 2007–11 to the 10th largest in 2012–16, with arms imports increasing by 202 per cent. This was the highest growth rate among the top 10 importers in 2012–16. The Philippines has started a military expansion programme and increased its arms imports by 426 per cent between 2007–11 and 2012–16. Indonesia, more indirectly affected by the maritime tensions, increased its imports by 70 per cent. Singapore’s arms imports decreased by 47 per cent. However, it was still absorbing the major arms acquisitions that made it the world’s 7th largest arms importer in 2007–11.
India
As the largest importer of major arms in 2012–16, India accounted for 13 per cent of the global total. Between 2007–11 and 2012–16, India’s imports increased by 43 per cent. India’s imports in the most recent period were far greater than those of its regional rivals, China and Pakistan. A major reason for the high level of imports is that India’s arms industry has largely failed to produce competitive indigenously designed weapons.
In 2012–16 Russia supplied 68 per cent of India’s arms imports, the USA 14 per cent and Israel 7.2 per cent. Based on existing orders and weapons, Russia will remain, by far, the main supplier of major arms to India for the foreseeable future. However, India expects increasing deliveries due to several major orders from France (another traditional supplier) and from the USA, South Korea and Spain—all of which only recently became suppliers of major weapons to India.
China
China is increasingly capable of producing its own advanced weapons and has become less dependent on arms imports, which decreased by 11 per cent between 2007–11 and 2012–16. While China was the largest importer globally by a wide margin in the early-2000s, it dropped to fourth place in 2012–16. China remains partly dependent on imports for some key weapons and components, including large transport aircraft and helicopters, and engines for aircraft, vehicles and ships. Engines accounted for 30 per cent of China’s imports in 2012–16. China’s largest supplier was Russia, which accounted for 57 per cent of Chinese imports, followed by Ukraine (16 per cent) and France (15 per cent).
Australia
Australia’s imports of major weapons accounted for 3.3 per cent of the global total in 2007–16, with a marginal difference in import volumes for 2007–11 and 2012–16. Australia’s imports are aimed at giving the country capabilities to operate further from its shores than before and are partly to counter a perceived growing threat from China. Large orders for combat aircraft and frigates are to be fulfilled in the coming years and 12 submarines were ordered in 2016.
Europe
Imports by states in Europe decreased by 36 per cent between 2007–11 and 2012–16, with the region accounting for 11 per cent of total global imports. Economic pressures forced states such as Greece and Spain to greatly reduce their arms imports. Although the UK’s arms imports decreased by 22 per cent between 2007–11 and 2012–16, the country remained the largest importer of major weapons in Europe. The USA accounted for 32 per cent of deliveries to Europe, followed by the Germany (14 per cent) and Russia (13 per cent).
West and Central European combat aircraft imports
During 2012–16 several states in Western and Central Europe were involved in programmes to import new combat aircraft. In particular, the introduction of the new generation of US-supplied F-35s in several European air forces will drive arms import volumes up in Europe in the next five years. During 2012–16 the UK received 5 out of 138 F-35s, Italy received 6 out of 90, Norway 4 out of a planned order of 52 and the Netherlands received 2 out of 37. In 2016 Denmark selected the F-35 for a planned order of 27.
Countries bordering Russia
Largely based on what they perceive is a growing threat from Russia, several countries bordering Russia have embarked on arms import programmes. However, arms imports by Estonia, Latvia and Lithuania in 2012–16 were still below those of 2007–11. Similarly, new arms procurement programmes in Poland have not resulted in large deliveries yet, and its arms imports levels in 2012–16 were 50 per cent of those in 2007–11. However, in 2016, Poland saw the first results of its investment in long-range strike capabilities, with the US delivery of the first of 68 AGM-158A air-launched cruise missiles with a 370-kilometre range. In addition, it ordered 70 AGM-158B with a 925-km range in 2016. Finland also received the first of 70 AGM-158A on order from the USA in 2016.
Azerbaijan and Armenia
Imports by Azerbaijan and Armenia—whose conflict over Nagorno-Karabakh flared up again in 2016—remained asymmetric. In 2012–16 Azerbaijan’s imports were 75 per cent higher than in 2007–11, and 20 times higher than those of Armenia. Armenia’s most noticed arms import consisted of a small number of 280-km range surface-to-surface missiles, which can reach nearly all of Azerbaijan. Azerbaijan imported a much wider variety of weapons, including tanks and armoured vehicles, anti-ballistic missile systems and combat aircraft. Russia was an important supplier to both.
Box 2. Transfers of airborne and space-based long-range sensors
Airborne and space-based long-range intelligence, surveillance and reconnaissance (ISR) systems only account for a small portion of the total volume of arms transfers. However, as so-called force multipliers, they can significantly increase the defensive or offensive combat potential of an existing force.
Transfers of small numbers of long-range airborne ISR systems have occurred regularly since the 1980s. In 2012–16 the United States delivered 4 airborne early warning (AEW) systems to Turkey, 1 to Australia and 2 to South Korea. It also delivered 2 long-range signal intelligence aircraft to the United Kingdom, 1 to Italy and 1 long-range unmanned aerial vehicle with an airborne ground surveillance system to the North Atlantic Treaty Organization (NATO). Israel delivered 1 long-range AEW system to Italy and 2 long-range airborne ground surveillance systems to India. Sweden delivered 2 AEW aircraft to Saudi Arabia and 1 to Thailand. China delivered 3 AEW aircraft to Pakistan. By the end of 2016, Australia, India, Italy, Japan, Qatar, the United Arab Emirates, the UK and Thailand had further systems on order.
International transfers of remote-sensing satellites—acquired for purely military or for both military and civilian purposes—are a newer development. The first identified international transfer was a French satellite to Taiwan in 2005. This was followed by deliveries of 1 Russian satellite each to Egypt and South Africa in 2014, and of 1 Italian satellite to Turkey and 1 French satellite to Peru in 2016. Additional French satellites are on order for Morocco, the United Arab Emirates and Egypt, and an Israeli satellite has been ordered by Italy.
The Middle East
Arms imports by states in the Middle East increased by 86 per cent between 2007–11 and 2012–16. During 2012–16 28 per cent of arms transfers to the region went to Saudi Arabia, 16 per cent to the UAE and 11 per cent to Turkey. The USA accounted for 53 per cent of total arms supplies to the region, the UK for 8.9 per cent and France for 8 per cent. The region's main arms importers invested in advanced systems that can significantly increase the potential of their armed forces. For example, several states received or ordered airborne and space-based long-range sensors (see box 2).
The Gulf region
Most Arab states of the Gulf are militarily involved in armed conflicts in Yemen, Syria or on their own territory and have tense relations with Iran. In 2012–16 Saudi Arabia’s arms imports increased by 212 per cent compared with 2007–11. It became the world’s second-largest arms importer, accounting for 8.2 per cent of global arms imports in 2012–16. The UAE has continuously had high levels of arms imports since 2001. Its arms imports increased by 63 per cent between 2007–11 and 2012–16. Qatari arms imports rose by 245 per cent between 2007–11 and 2012–16 as part of a programme that will multiply its military assets several times. Kuwaiti arms imports increased by 175 per cent between 2007–11 and 2012–16.
Due to a partial arms embargo imposed by the United Nations as well as economic pressures, Iran’s arms imports remained at a very low level in 2012–16, at 1.2 per cent of total arms transfers to the Middle East. The delivery by Russia in 2016 of four air defence systems, which do not fall under the UN arms embargo, was the first significant import of major arms by Iran since 2007.
Arms imports and the fighting in Iraq, Syria and Turkey
Arms imports by Iraq increased by 123 per cent between 2007–11 and 2012–16. As in 2007–11, Iraq received thousands of light-armoured vehicles in 2012–16. However, it was in particular the delivery of 29 combat aircraft from the USA, 24 combat aircraft from South Korea and 43 combat helicopters from Russia that contributed to the increase. Many of the newly received weapons were immediately used in the fight against the Islamic State.
Turkey was the sixth-largest arms importer globally in 2012–16 and increased its arms imports by 42 per cent in 2012–16 compared with 2007–11. Imported combat aircraft and helicopters, tanks and artillery were deployed in the fighting with Kurdish rebels, and in Syria against the Islamic State. By contrast, imports of major arms by the Assad regime in Syria were very low during 2012–16, with the regime having to rely on stocks of major arms supplied before the war started in 2011.
Egypt
Arms imports by Egypt grew by 69 per cent between 2007–11 and 2012–16. During 2012–16 the USA and France each accounted for 40 per cent of Egyptian arms imports. However, Egypt is diversifying its supplier base and signed large arms deals with Russia in 2015, including contracts for 50 combat aircraft and 46 combat helicopters.
Israel
Israel’s arms imports were relatively stable during 2007–16, increasing 12 per cent between 2007–12 and 2012–16. The USA accounted for 52 per cent of these transfers. In 2016 the USA agreed to the continuation of its large-scale military aid to Israel. An important element of this aid is the supply of 50 advanced F-35 combat aircraft, which the USA does not yet want to supply to Arab countries. The first two of these were delivered to Israel in 2016.
Note
1 The SIPRI Arms Transfers Database contains information, often estimates, on all international transfers of major weapons (including sales, gifts and production under licence) to states, international organizations and armed non-state groups since 1950. It is the only publicly available resource providing consistent data on arms transfers for this length of time. The database aims to support efforts to better understand the effects of arms flows on peace, stability and violent conflict. The database is accessible at <http://www.sipri.org/databases/armstransfers/>.
About the Authors
Dr Aude Fleurant is Programme Director, Pieter D. Wezeman and Siemon T. Wezeman are Senior Researchers and Dr Nan Tian is a Researcher with the SIPRI Arms and Military Expenditure Programme.
For more information on issues and events that shape our world, please visit the CSS Blog Network or browse our Digital Library.