No 106, Caucasus Analytical Digest: Political Regime-Related Country Rankings
15 Nov 2018
By Heiko Pleines for Center for Security Studies (CSS)
The article featured here was originally published by the Center for Security Studies in the Caucasus Analytical Digest on 25 October 2018.
A Critical Reflection on the Validity of Political Regime-Related Country Rankings
By Heiko Pleines, Research Centre for East European Studies at the University of Bremen
DOI: external page<10.3929/ethz-b-000298306>
The Nature of the Rankings
Since Freedom House began assessing the extent of freedom in the countries of the world in 1972, the idea of handing out “report card”-style audits to entire states has won increasing numbers of supporters. In the last decade, several organizations launched new projects which systematically and comparatively assess the political state of affairs. As a result, the areas under investigation are being increasingly differentiated and the rating systems are becoming increasingly complex.
Whereas the first Freedom House project, Freedom in the World, only differentiated political and civil rights, the organization’s Nations in Transit series, begun in 1995, now encompasses seven topic areas ranging from “democracy and governance”, “electoral process”, “independent media”, “civil society”, and “corruption” to “judicial framework and independence”. The Bertelsmann Transformation Index, which was introduced in 2003, evaluates nearly 40 indicators. The Global Integrity Report, which was first issued in the same year, tracks almost 300 indicators, but due to this in-depth level of investigation, only covers a smaller number of countries. In addition, there are several rankings that consciously focus only on certain aspects of a political system, such as freedom of the media or corruption.
The increasing number of indicators has also complicated the evaluation process. Whereas the first Freedom House ranking simply offers scores from 1 through 7 and groups all countries of the world into just three categories (free, partly free and unfree), the newer indices are based on composite values which allow for a more differentiated ranking of all countries in the world.
All political country rankings primarily refer to the ideals of democracy, human rights, and the rule of law, and assess the extent to which individual countries meet these ideals. Perfect democracies with rule of law thus receive the highest marks, while dictatorships are generally at the bottom of the tables. Some rankings, however, also take into account the rulers’ management qualities or socio-economic indicators and criteria related to economic policy.
Most of the rankings are based on expert assessments. As a rule, one or two experts write up a country study, which is subsequently reviewed and, if deemed necessary, corrected by other experts. The experts are generally well acquainted with the country in question in their capacities as academics or journalists. Alternatively, some indices such as the Corruption Perception Index published by Transparency International evaluate broader expert surveys. As a reaction to the increasing number of indices, the World Bank has created a meta-index. Worldwide Governance Indicators summarize the results of over 30 indices under the heading of a new index.
Valid Data?
While many academics use country rankings in order to compare democratization processes internationally and to identify causal factors in successful transformations, others view such rankings as public-relations stunts or even as misleading.
The limits of their explanatory power can be seen when comparing several indices that purport to measure the same variables. Since 2002, the freedom of the press has been assessed by as many as three independent rankings, namely Freedom of the Press Rating (Reporters without Borders), Nations in Transit—Media, and the Press Freedom Index (both from Freedom House). The significant discrepancies in the development of the individual indices for many countries illustrate the limitations of quantifying the freedom of the press.
Overall, there are three major points of criticism concerning political country rankings. The first problem is that they rely on the subjective appraisals of experts. These experts derive their opinions from journalistic publications and from their own personal assessments as academics, journalists, and business professionals; as a rule, they have no access to other non-public sources. At the same time, the experts, who generally only scrutinize one country, are limited in their ability to draw comparisons between different countries. Therefore, there is no guarantee that two experts assessing different countries that are on the same level of development will award the same ranking to their respective countries.
Because of changing experts and revisions of underlying criteria and indicators most rankings are also not comparable over time for the same country. Diego Giannone (2010) demonstrates this point exemplarily in an analysis of changes in the questionnaire of the Freedom House ranking. Moreover, a systematic analysis of Freedom House scores with rankings in other indices conducted by Nils Steiner (2014) comes to the conclusion that overall his analysis supports “the view of those who have argued that the FH scores would tend to favor US allies and/or disfavor major antagonists of the US government.” This point has been further elaborated by Sarah Sunn Bush (2017), who claims that the Freedom House ranking in fact offers information on “how U.S. elites perceive other countries’ political systems.”
Kyle L. Marquardt (2017) argues that “the key assumption of expert-coded datasets is that the consensus opinion of experts represents a reasonable approximation of a given concept’s ‘true value.’ Since experts disagree, incorporating disagreement into the measurement of a concept is a necessary step in creating expert-coded datasets, and a step which precedes aggregating low-level variables into higher level concepts such as democracy.”
The World Bank also tones down the applicability of its Worldwide Governance Indicators in the fine print. The section on “frequently asked questions” states that changes in country rankings over time may be caused by four different factors. Three of these are related to changes in surveying methods and are not connected to the development of the country in question. In conclusion, it is stated that two of these factors “typically only have very small effects on changes”.
The second problem of country rankings is the index construction. Often far-reaching assessments are drawn from a relatively low number of specific indicators. Moreover, the selection and weighting of the individual indicators has necessarily a subjective dimension and can influence the final index value considerably. That means the rankings do not simply state facts. They in fact claim that some aspects of political systems are more important than others and they try to have an impact on public debates through publication of their rankings. Again the study by Diego Giannone (2010) presents related criticism in a concise way.
A third problem of country rankings is the focus on precise scores and ranks, which suggest an accurateness which is simply not given. Often insignificant differences in the scores of individual dimensions of the rankings can move countries up or down several places. Bjorn Hoyland et.al. (2012) have studied the uncertainty inherent in the estimation of scores. In this respect they praise the approach by Freedom House: “The classification of countries into groups based on the index score is in our view a better strategy than providing complete country rankings based on the same index score. While complete country rankings are very uncertain, the allocation of countries into groups is a much less uncertain endeavour, provided that one is willing to accept a limited number of groups.”
Conclusion
In summary the validity of country rankings is limited and results need to be assessed critically. This is why, for example, the World Bank declares: “We recognize there are limitations to what can be achieved with this kind of crosscountry, highly-aggregated data. Therefore, this type of data cannot substitute for in-depth, country-specific governance diagnostics as a basis for policy advice to improve governance in a particular country, but should rather be viewed as a complementing tool.” This is probably also why most organizations supply extensive country studies together with their country rankings. These, however, generally tend to be disregarded by the media and the general public. A major problem of country ratings is thus that shorthand representations in the news media overstretch the explanatory power of such indices.
Documentation
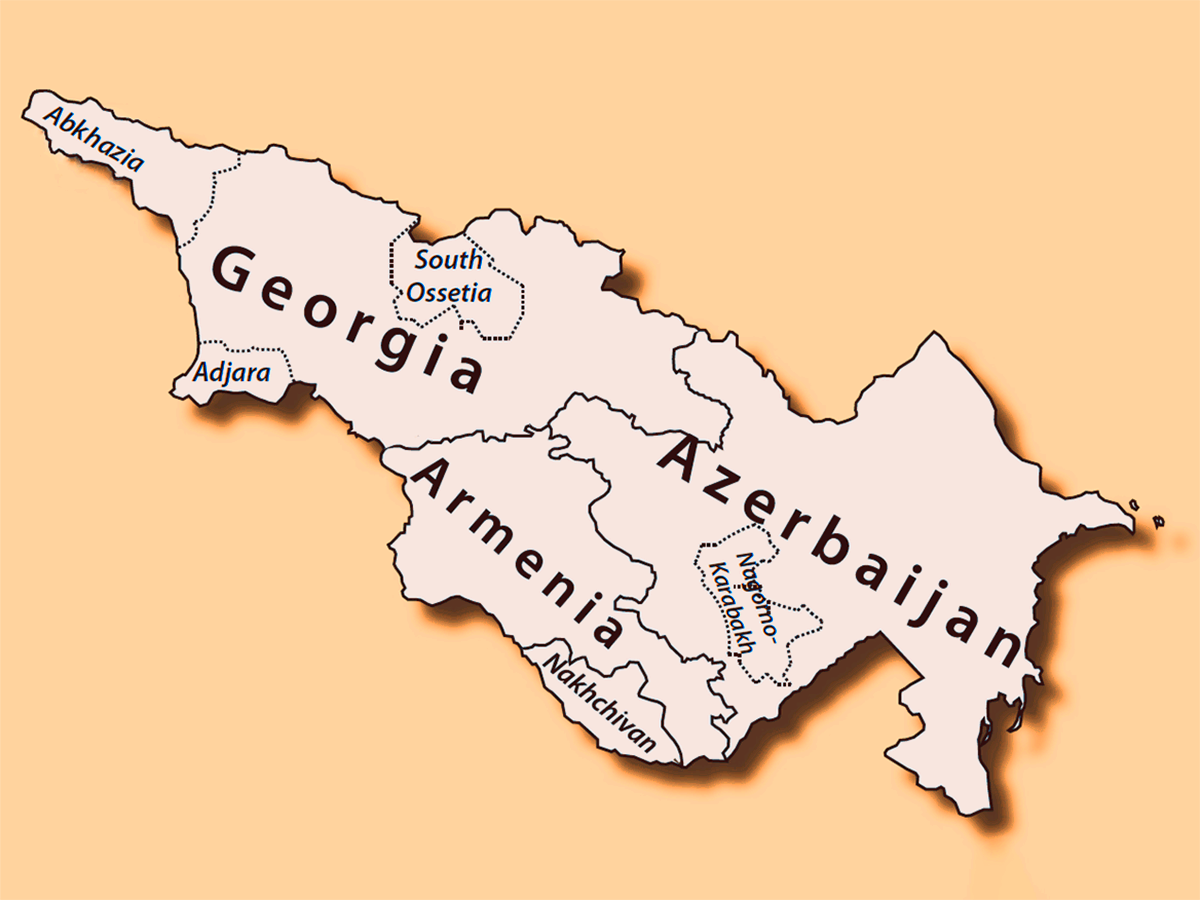
The following documentation offers an overview of the major political country rankings and their evaluation of the three countries of the South Caucasus. Each ranking is briefly introduced based on information provided online by the institution responsible for the ranking. Please follow the respective links for further information on the rankings. For each ranking the development of the values of the three South Caucasian countries is indicated in tables and graphs.
Bibliography
Staffan Andersson, Paul M. Heywood (2009): The politics of perception: use and abuse of Transparency International’s approach to measuring corruption, in: Political Studies, 57(4), 746–767.
Carmen R. Apaza (2009): Measuring governance and corruption through the worldwide governance indicators. Critiques, responses, and ongoing scholarly discussion, in: PS: Political Science & Politics, 42(1), 139–143.
Matthijs Bogaards (2012): Where to draw the line? From degree to dichotomy in measures of democracy, in: Democratization 19(4), 690–712.
Alexander Cooley and Jack Snyder (2015): Ranking the World: grading states as a tool of global governance, Cambridge University Press.
Diego Giannone (2010): Political and ideological aspects in the measurement of democracy. The Freedom House case, in: Democratization, 17(1), 68–97.
Högström, John (2013): Classification and rating of democracy: a comparison., in:Taiwan Journal of Democracy, 9(2), 33–54.
Bjorn Hoyland, Karl Moene, Frederik Willumsen (2012): The tyranny of international index rankings, in: Journal of Development Economics, 97, 1–14.
Stephen Knack: Measuring corruption in Eastern Europe and Central Asia. A critique of the cross-country indicators. Washington, DC: World Bank 2006 (World Bank Policy Research Working Paper No. 3968).
Hadi Strommen Lile (2017): Lost in operationalisation: developing legally relevant indicators, questions and benchmarks, in: The International Journal of Human Rights, 21(9), 1378–1400.
Kyle L. Marquardt (2017): Measuring democracy with expert-coded data, in: Comparative Democratization, 15(2), 6+17–21.
Gerardo L. Munck (2011): Measuring Democracy. Framing a needed debate, in: Comparative Democratization (APSA), 9(1), 1–7.
Nils D. Steiner (2014): Comparing Freedom House Democracy Scores to Alternative Indices and Testing for Political Bias: Are US Allies Rated as More Democratic by Freedom House?, in: Journal of Comparative Policy Analysis, 18(4), 329–349.
Sarah Sunn Bush (2017): The Politics of Rating Freedom: Ideological Affinity, Private Authority, and the Freedom in the World Ratings, in: Perspectives on Politics, 15(3), 711–731.
Carl J. Bon Tempo (2011): From the Center-Right: Freedom House and Human Rights in the 1970s and 1980s, in: Akira Iriye, Petra Goedde and William I. Hitchcock (eds.): The Human Rights Revolution. An International History, Oxford University Press.
Jan Teorell (2011): Over time, across space. Reflections on the production and usage of democracy and governance data, in: Comparative Democratization (APSA), 9(1), 7–11.
Sebastian Ziaja (2012): What Do Fragility Indices Measure? Assessing Measurement Procedures and Statistical Proximity, in: Gert Pickel, Susanne Pickel (eds): Indizes in der Vergleichenden Politikwissenschaft, Wiesbaden: Springer VS, 39–65.
About the Author
Heiko Pleines is Head of the Department of Politics and Economics at the Research Centre for East European Studies and Professor of Comparative Politics at the University of Bremen. He has been working as an independent country expert for the Bertelsmann Transformation Index, Global Integrity and Transparency International. Heiko Pleines is head of the Discuss Data Project, which is funded by the German Research Foundation (DFG, grant No. PL 621/3-1 + HO 3987/26-1). The full dataset has been prepared for the Discuss Data project and will be available online at <external pagehttps://www.discuss-data.net/>.
Documentation
Political Regime-Related Country Rankings
This documentation aims to include all global country rankings related to political regimes and sub-categories of political regimes which:
- Assign scores in the form of numbers,
- Are based on an elaborated methodology which is documented,
- Include countries of the South Caucasus region,
- Are published regularly covering a period of several years since the end of the Soviet Union, i.e. since 1992.
For all rankings, which fulfil the selection criteria, the general or total scores of the South Caucasus countries have been included in this documentation. The scores provided by the original source have been copied without any changes to the values. Later revisions of earlier data have been incorporated as of September 2018.
When using the ranking data it is important to check whether the year indicated in the ranking refers to the year covered by the ranking or to the year of publication. The respective information is given for each ranking in the following documentation.
There is a controversial debate about the reliability, validity and informative value of country rankings. A brief introduction to this debate is given in the preceding article. It also includes an extensive bibliography of academic literature on the validity of political regime-related country rankings.
Bertelsmann Transformation Index (BTI)
Prepared by: Bertelsmann Foundation (Gütersloh, Germany)
Since: 2003 Frequency: Every two years
The years indicated in the ranking refer to the year of publication. The scores cover the period up to January of the preceding year, i.e. the 2018 value is for the period from February 2015 to January 2017.
Countries included: 116 (2003), 129 (since 2005)
URL: <external pagehttps://www.bti-project.org/en/index/methodology/>
Figure 1: Bertelsmann Transformation Index (BTI): BTI Status Index
The Status Index, with its two analytic dimensions of political and economic transformation, identifies where each of the 129 countries stand on their path toward democracy under the rule of law and a social market economy. Range of scores: 1 (worst) to 10 (best)
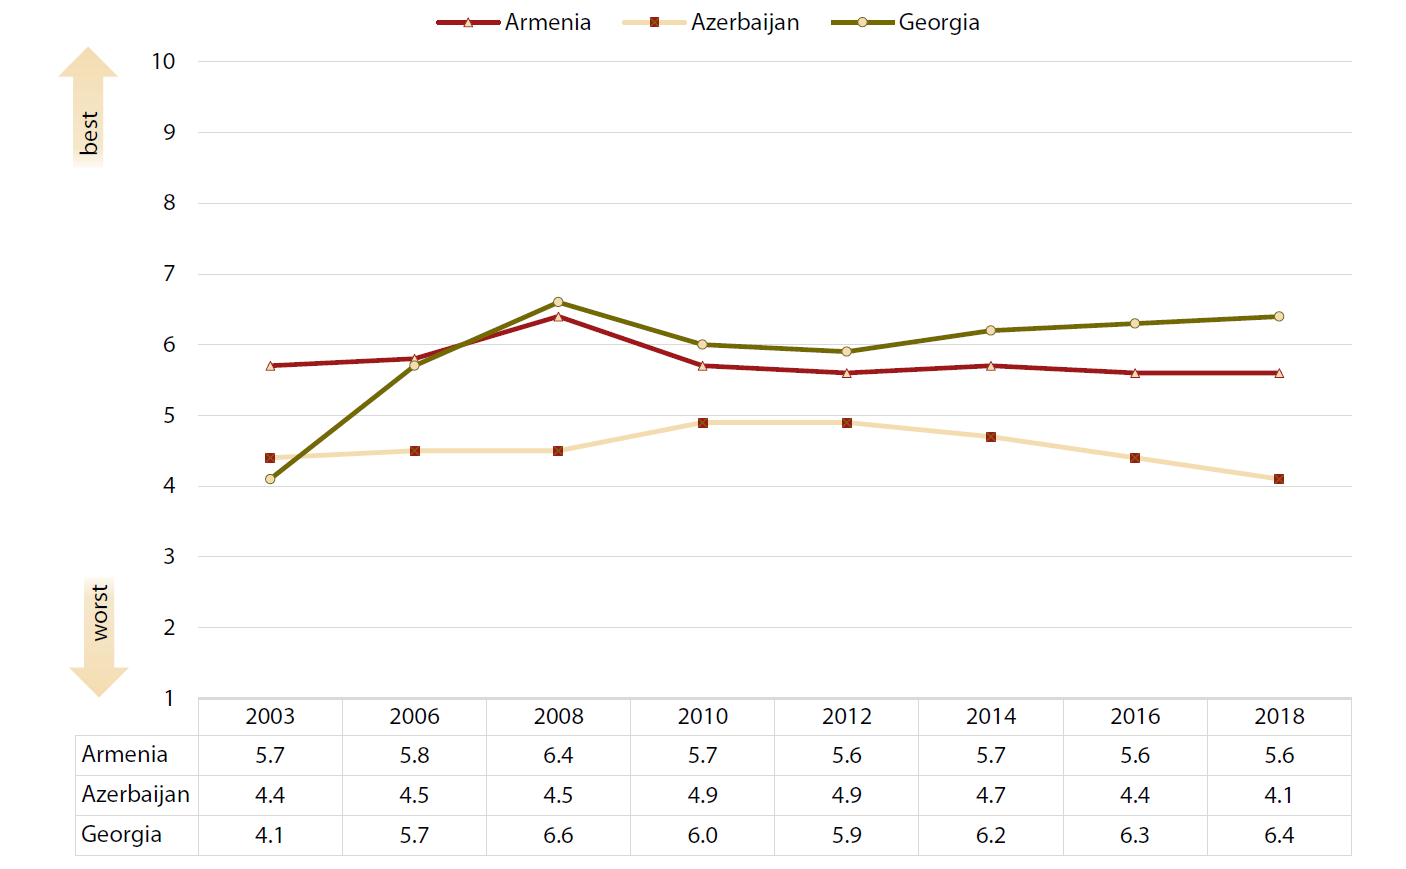
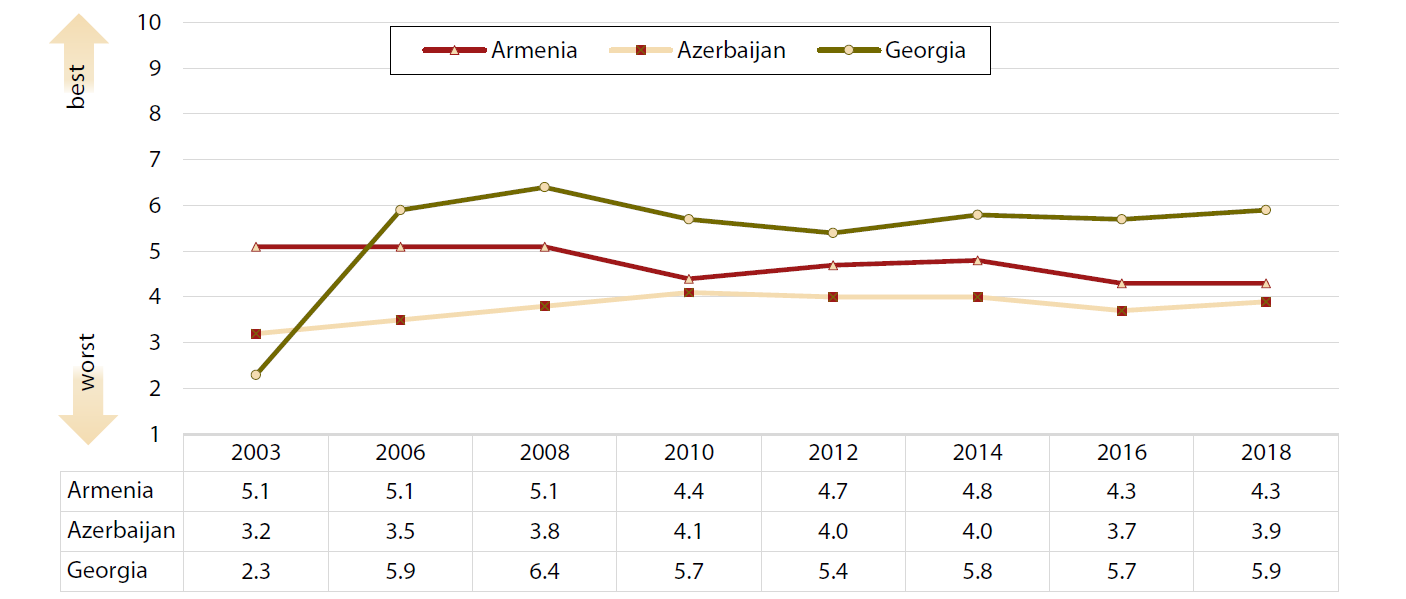
Figure 2: Bertelsmann Transformation Index (BTI): BTI Management Index
Focusing on the quality of governance, the Management Index assesses the acumen with which decision-makers steer political processes. Range of scores: 1 (worst) to 10 (best)
Economist Intelligence Unit: Index of Democracy
Prepared by: Economist Intelligence Unit (London, Great Britain)
Established: 2007
Frequency: 2006, 2008, annually since 2010
The years indicated in the ranking refer to the year covered.
Countries included: at present 165 states and 2 territories
URL: <external pagehttps://www.eiu.com/topic/democracy-index>
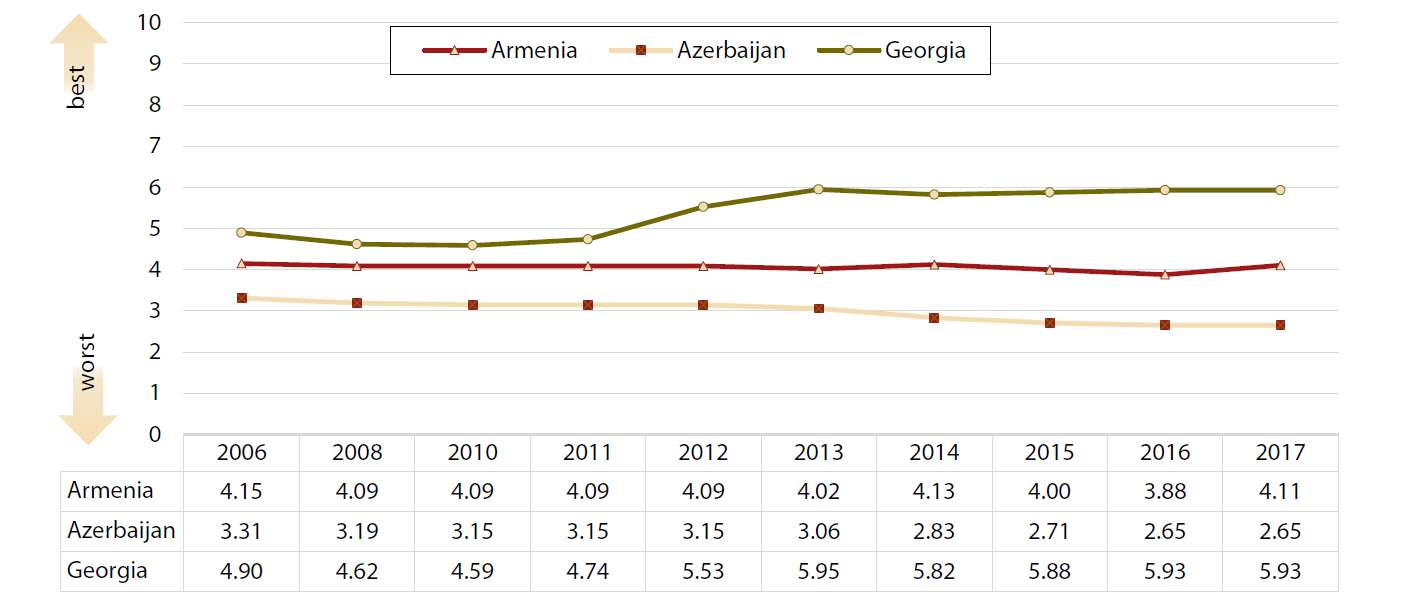
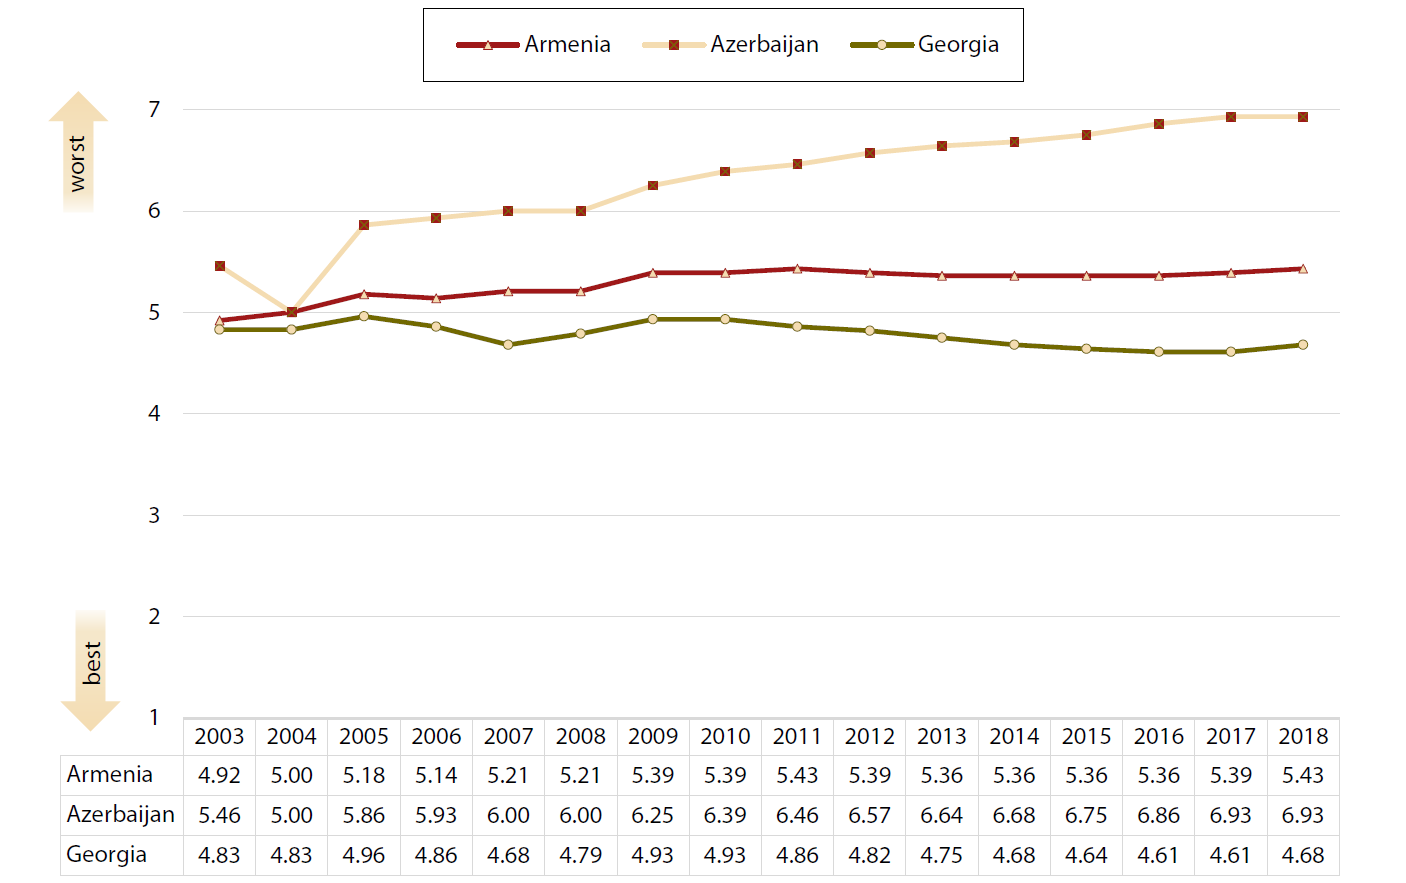
Figure 3: Economist Intelligence Unit: Index of Democracy
Range of scores: 0 (worst) to 10 (best)
Electoral Integrity Project: Perceptions of Electoral Integrity
Prepared by: Electoral Integrity Project (Harvard University and the University of Sydney)
Established: 2013
Frequency: irregular (depending on national election cycles)
Countries included: 107 (2017)
URL : <external pagehttps://www.electoralintegrityproject.com/>
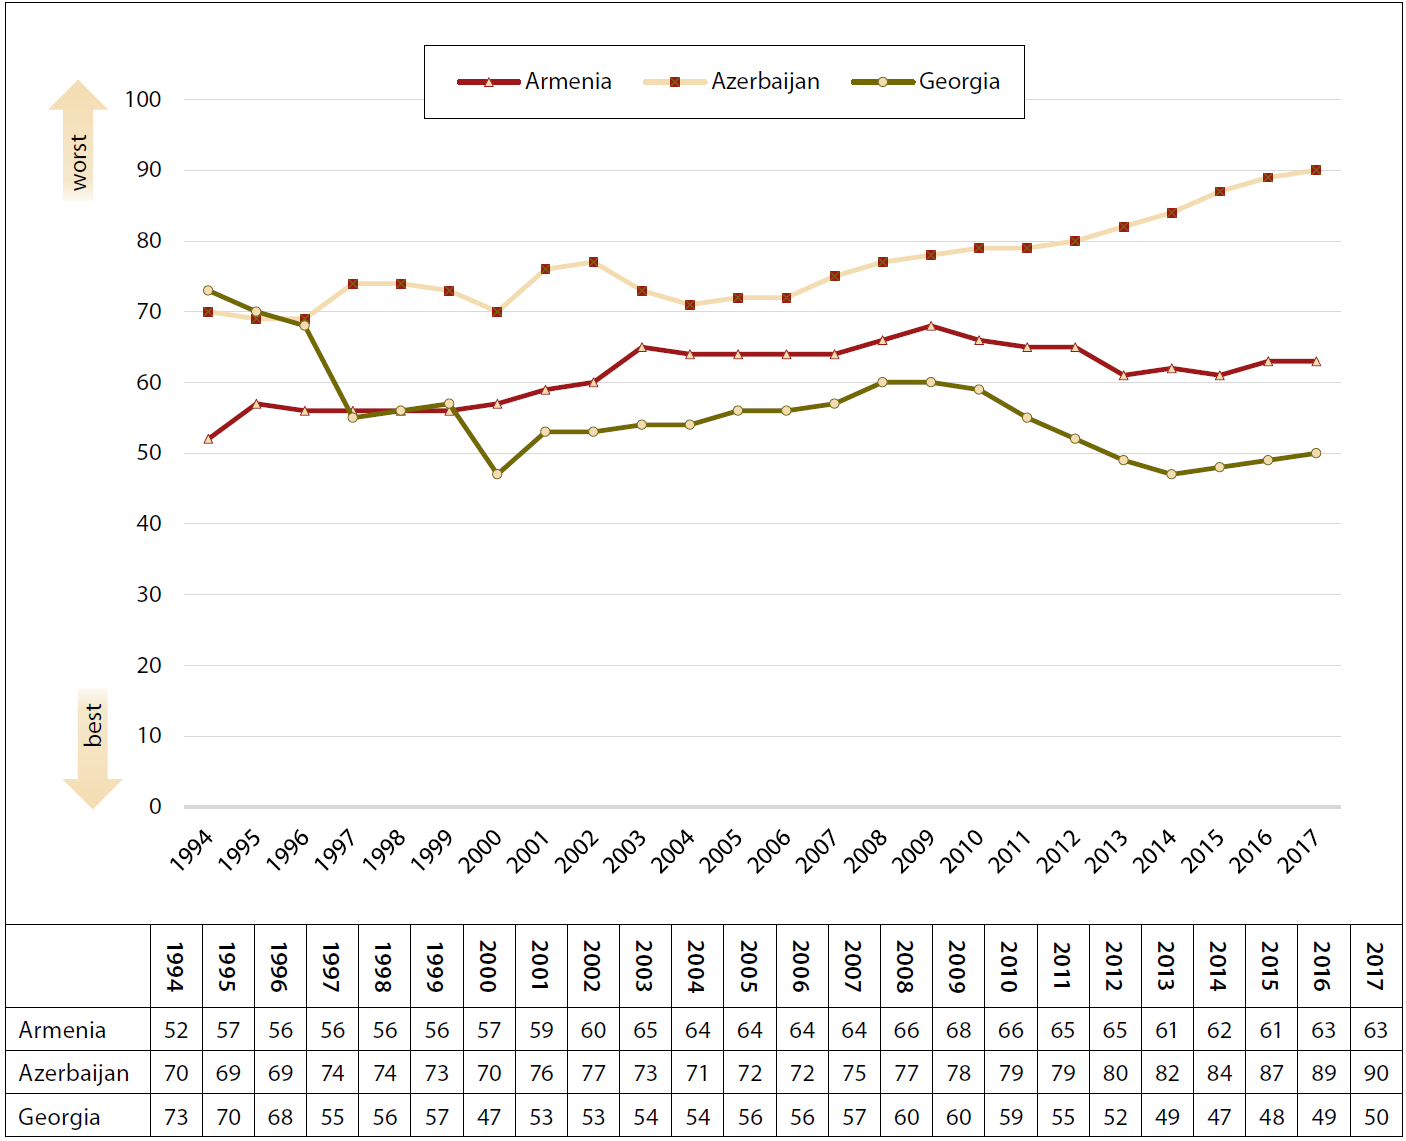
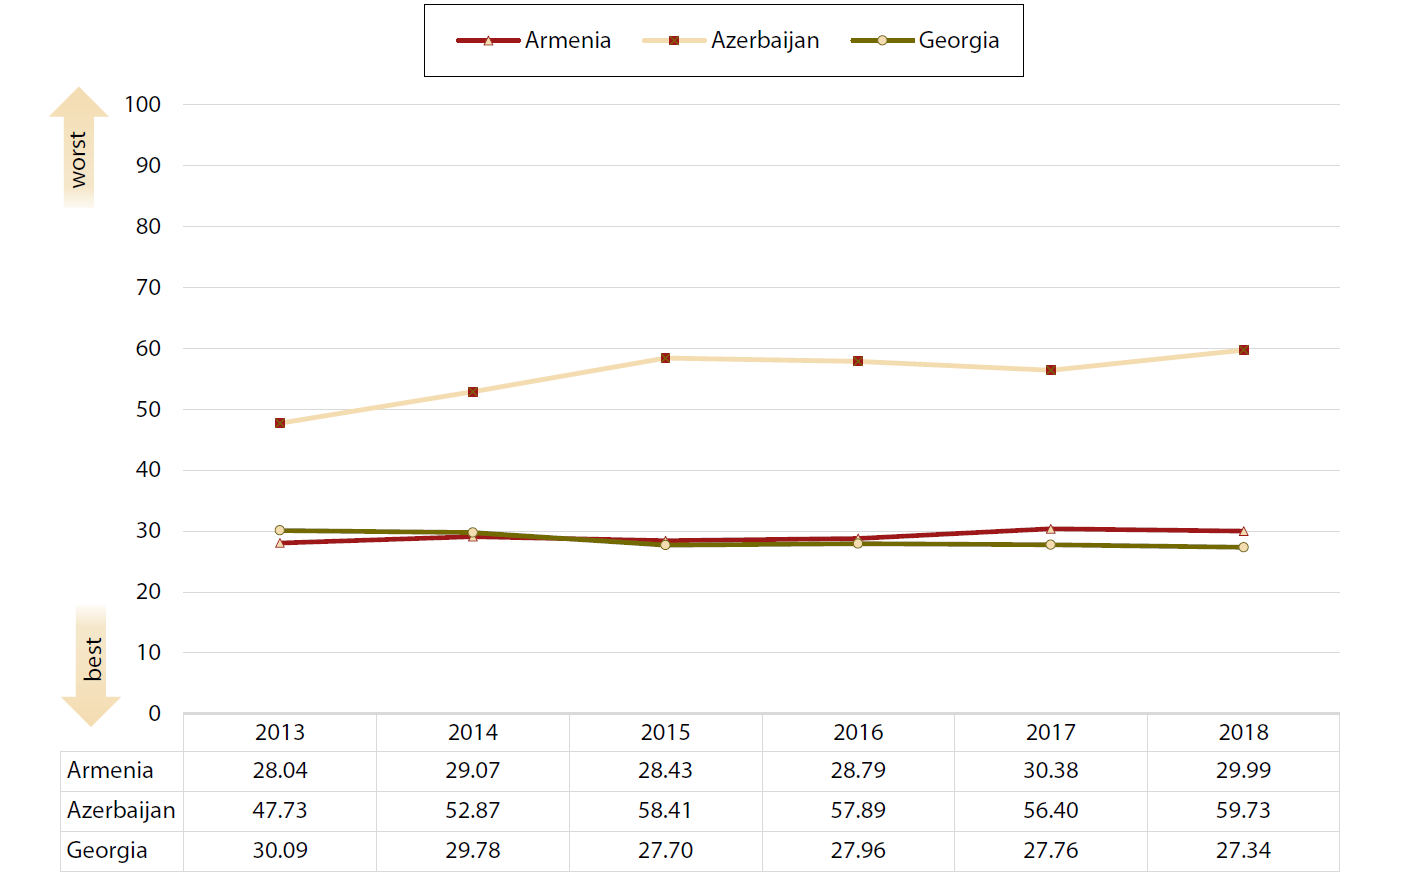
Figure 4: Electoral Integrity Project: Perceptions of Electoral Integrity (Score)
Range of scores: 0 (worst) to 100 (best)
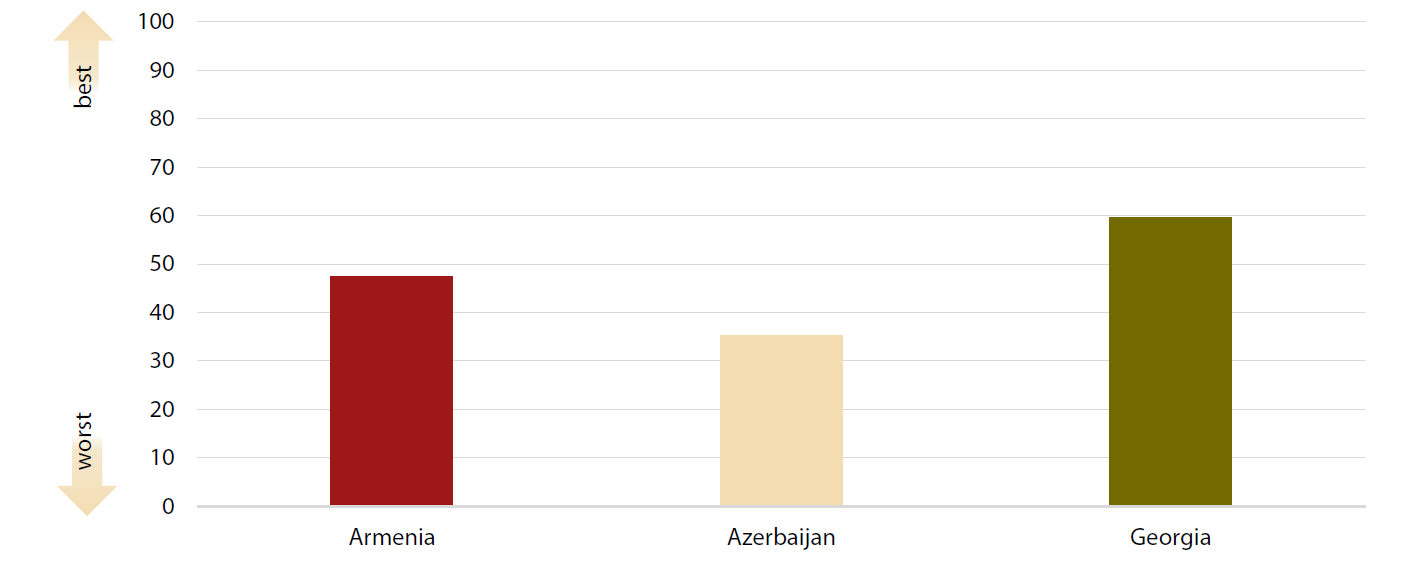
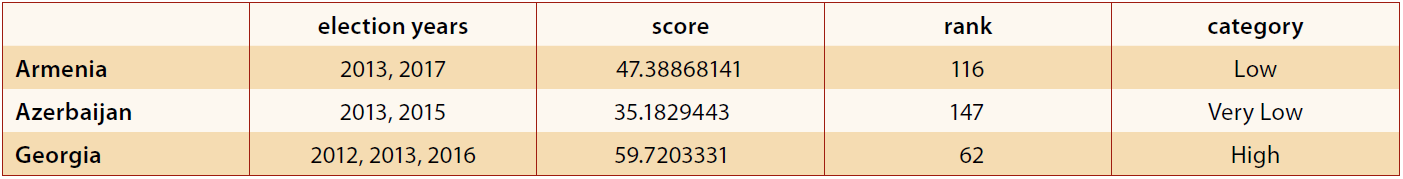
Table 1: Electoral Integrity Project: Perceptions of Electoral Integrity
Range of scores: 0 (worst) to 100 (best)
Freedom House: Freedom in the World
Prepared by: Freedom House (Washington, USA)
Established: 1972
Frequency: Annual
The years indicated in the ranking refer to the year of publication. The scores cover the respective preceding year, i.e. the 2018 value is for January to December 2017.
Countries included: 195 countries and 14 territories (2017)
URL: <external pagehttps://freedomhouse.org/report/methodology-freedom-world-2017>
Figure 5: Freedom House: Freedom in the World—Political Rights
Range of scores: 1 (best) to 7 (worst)
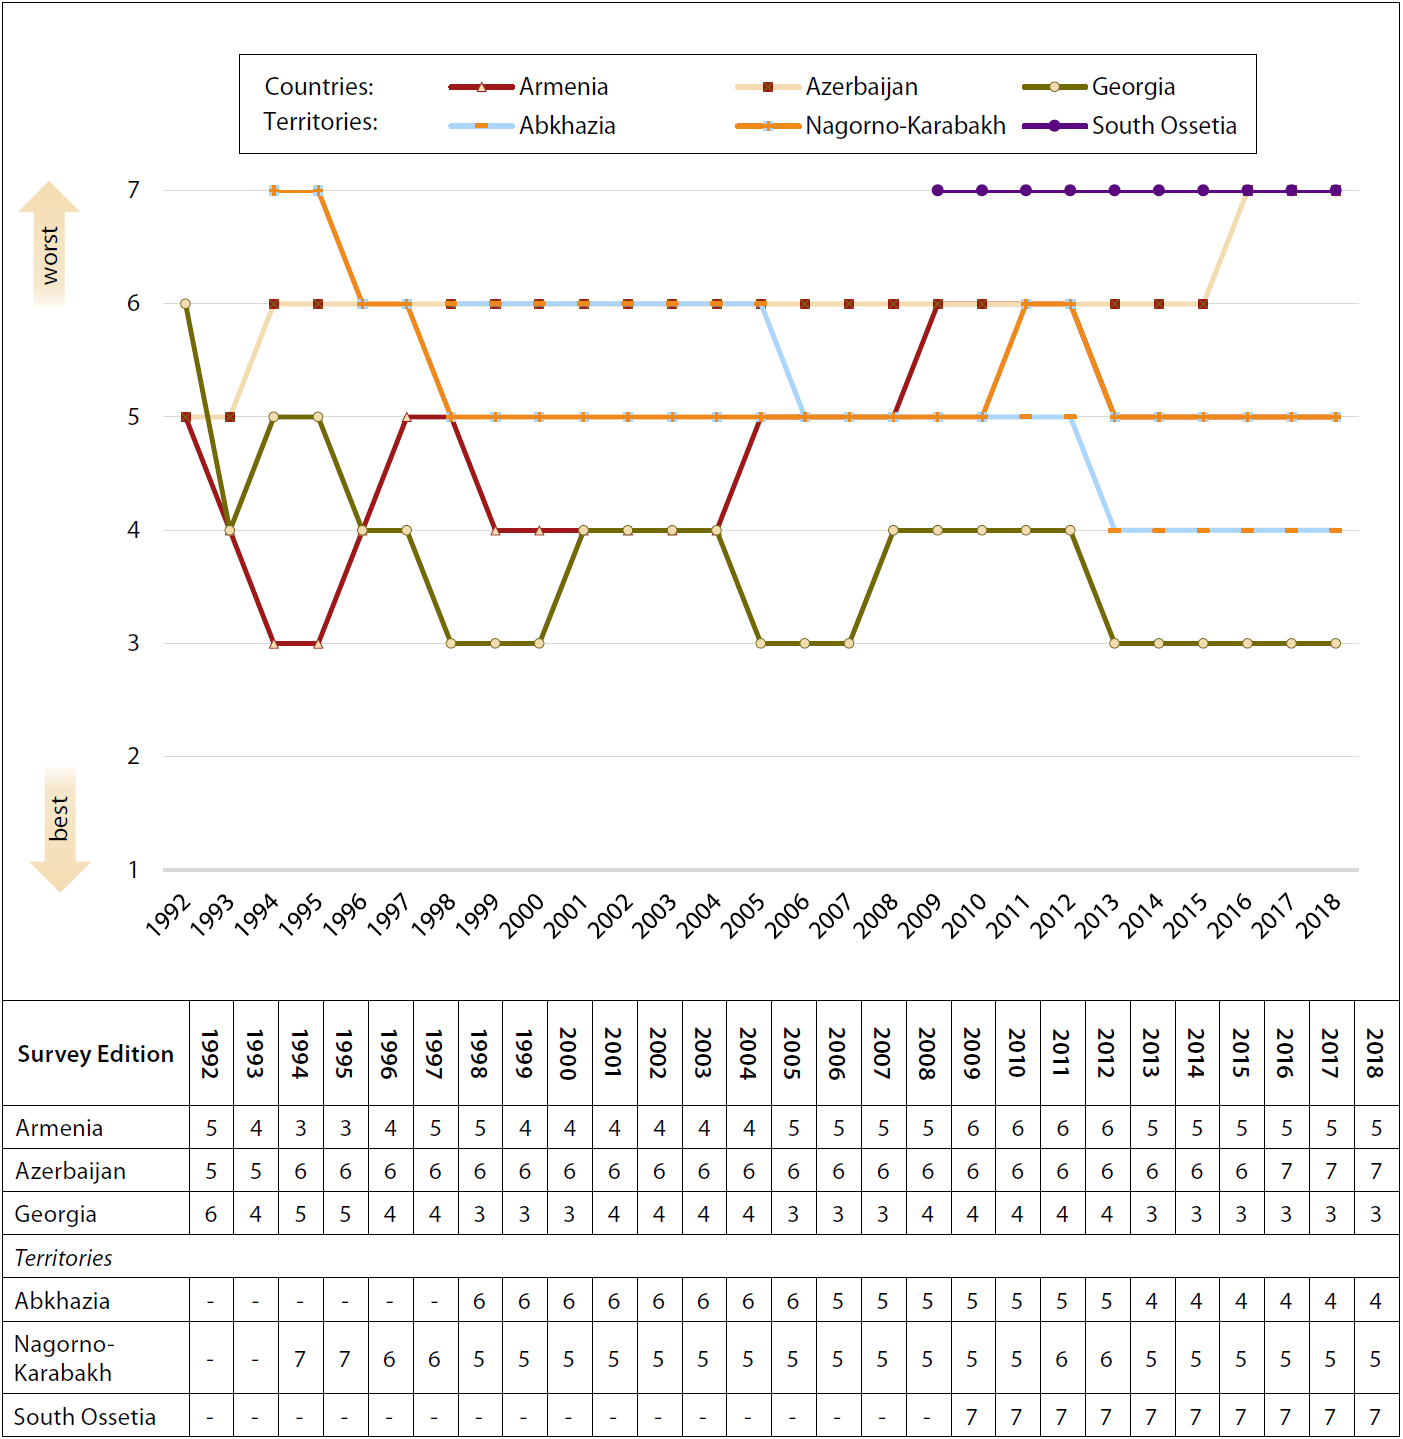
Figure 6: Freedom House: Freedom in the World—Civil Liberties
Range of scores: 1 (best) to 7 (worst)
Freedom House: Freedom on the Net
Prepared by: Freedom House (Washington, USA)
Established: 2011
Frequency: Annual
The ranking covers about 12 months up to the summer of the indicated year.
Countries included: 65 (2017)
URL: <external pagehttps://freedomhouse.org/report/freedom-net-methodology>
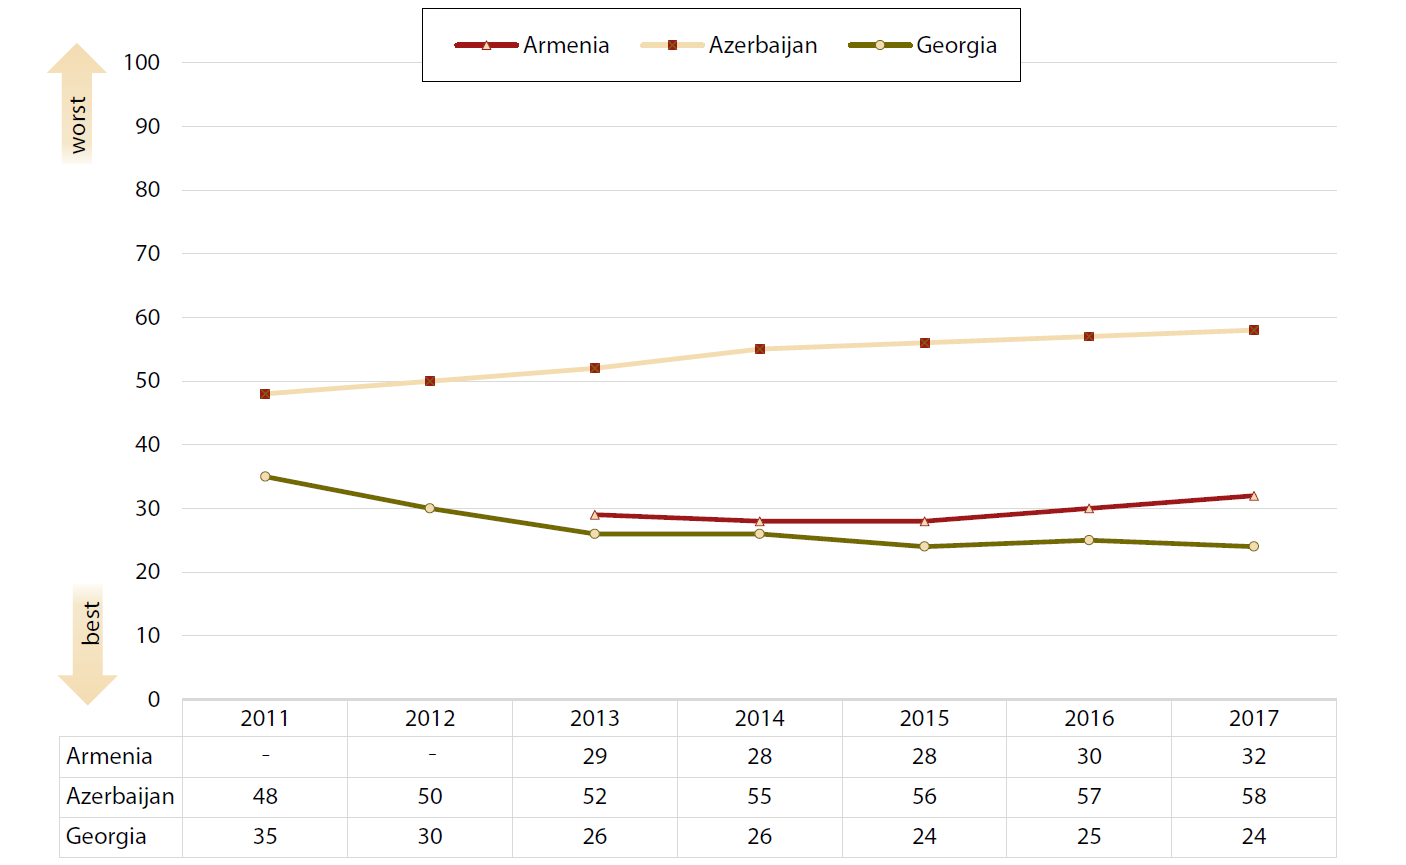
Figure 7: Freedom House: Freedom on the Net
Range of scores: 0 (best) to 100 (worst)
Freedom House: Freedom of the Press
Prepared by: Freedom House (Washington, USA)
Established: 1980
Frequency: Annual
The years indicated in the ranking refer to the year of publication. The scores cover the respective preceding year, i.e. the 2017 value is for January to December 2016.
Countries included: 199 countries and territories (2017)
URL: <external pagehttps://freedomhouse.org/report/freedom-press-2017-methodology>
Figure 8: Freedom House: Freedom of the Press
Range of scores: 0 (best) to 100 (worst)
Freedom House: Nations in Transit
Prepared by: Freedom House (Washington, USA)
Established: 1997
Frequency: Annual
The years indicated in the ranking refer to the year of publication. The scores cover the respective preceding year, i.e. the 2018 value is for January to December 2017.
Countries included: 29
URL: <external pagehttps://freedomhouse.org/report/nations-transit-methodology>
Figure 9: Freedom House: Nations in Transit—Democracy Score
Range of scores: 1 (best) to 7 (worst)
Fund for Peace: Fragile States Index (Former Failed State Index)
Prepared by: Fund for Peace—FFP (Washington, USA)
Established: 2005
Frequency: annually
The years indicated in the ranking refer to the year of publication. The scores cover the respective preceding year, i.e. the 2018 value is for January to December 2017.
Countries included: 75 (2005), 146 (2006), 178 (2015)
URL: <external pagehttp://fundforpeace.org/fsi/methodology/>
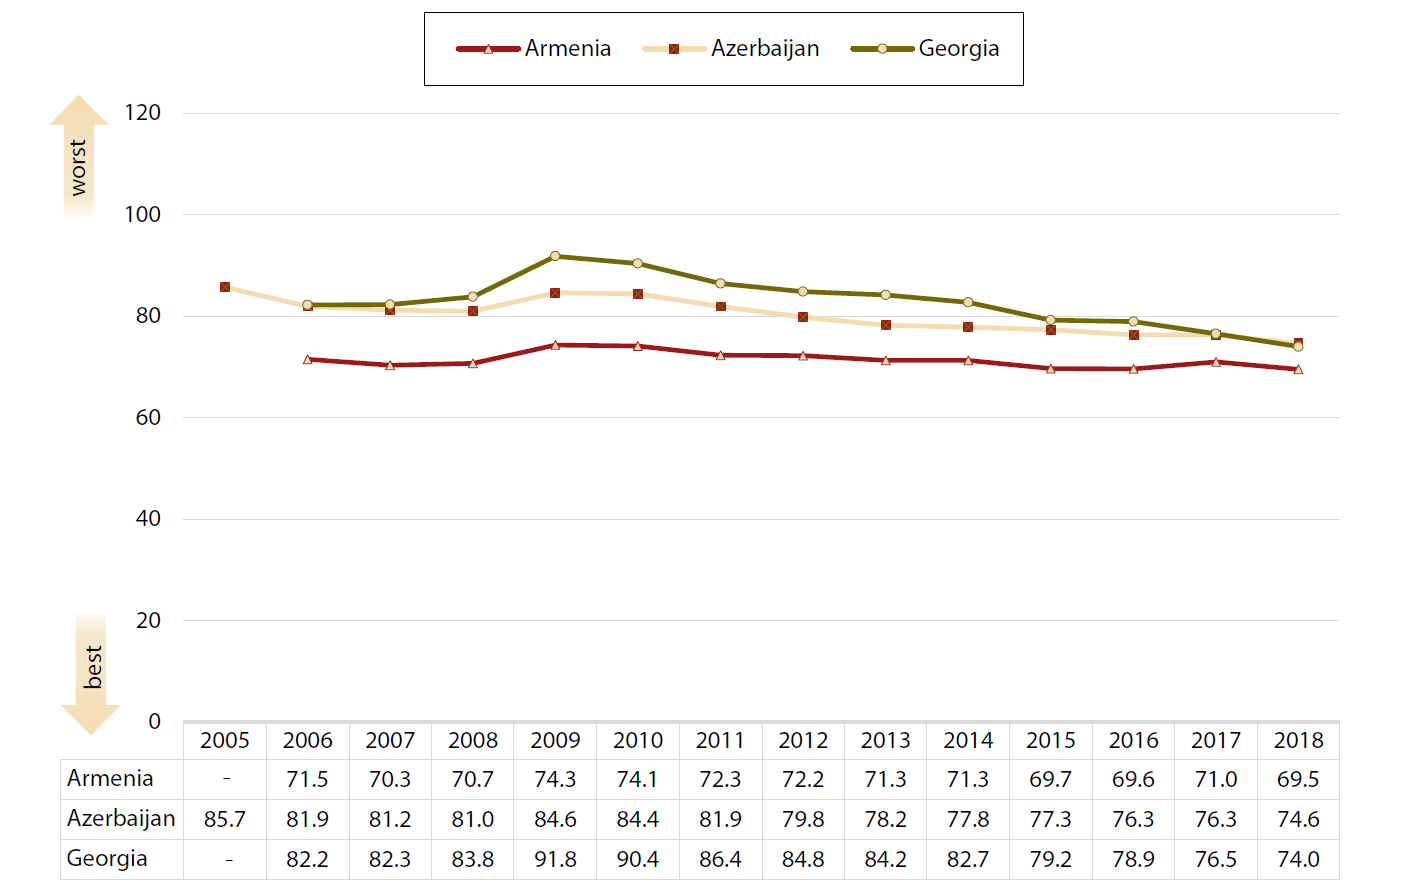
Figure 10: Fund for Peace: Fragile States Index
Range of scores: 0 (best) to 120 (worst)
Institute for Economics and Peace: The Global Peace Index
Prepared by: Institute for Economics and Peace (Sydney, Australia) with support from the Economist Intelligence Unit.
Established: 2006, data only available since 2008
Frequency: annually
The years indicated in the ranking refer to the year of publication. The scores cover the respective preceding year, i.e. the 2018 value is for January to December 2017.
Countries included: 163 (2018)
URL: <external pagehttp://visionofhumanity.org/indexes/global-peace-index/>
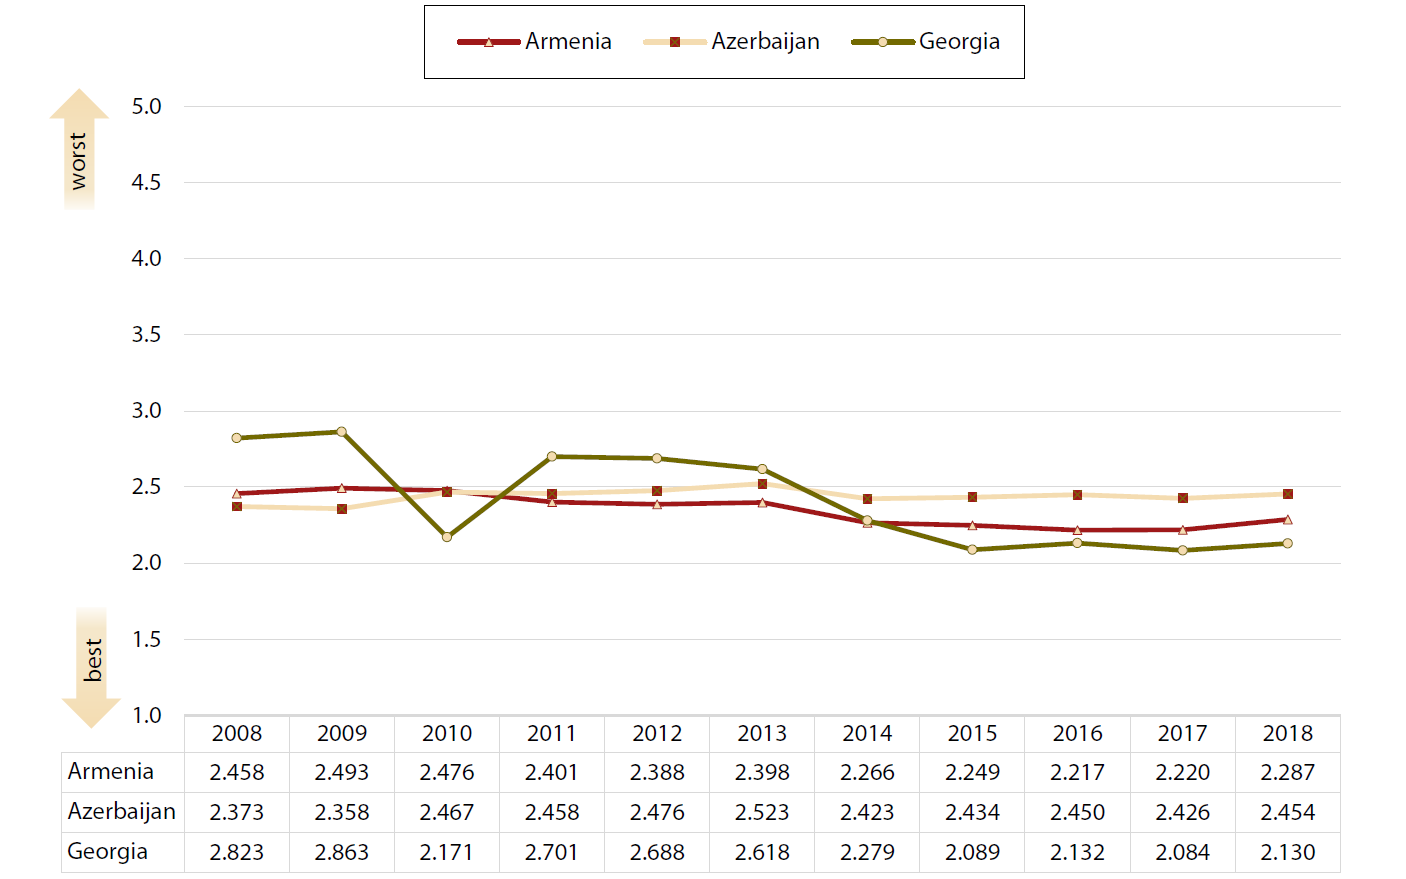
Figure 11: Institute for Economics and Peace: The Global Peace Index
Range of scores: 1 (best) to 5 (worst)
Institute for Economics and Peace: The Global Terrorism Index
Prepared by: Institute for Economics and Peace (Sydney, Australia) with data from the Global Terrorism Database
compiled at the University of Maryland (USA).
Established: 2002
Frequency: annually
The years indicated in the ranking refer to the year of publication. The scores cover the respective preceding year, i.e.
the 2017 value is for January to December 2016.
Countries included: 163 (2017)
URL: <external pagehttp://visionofhumanity.org/indexes/terrorism-index/>
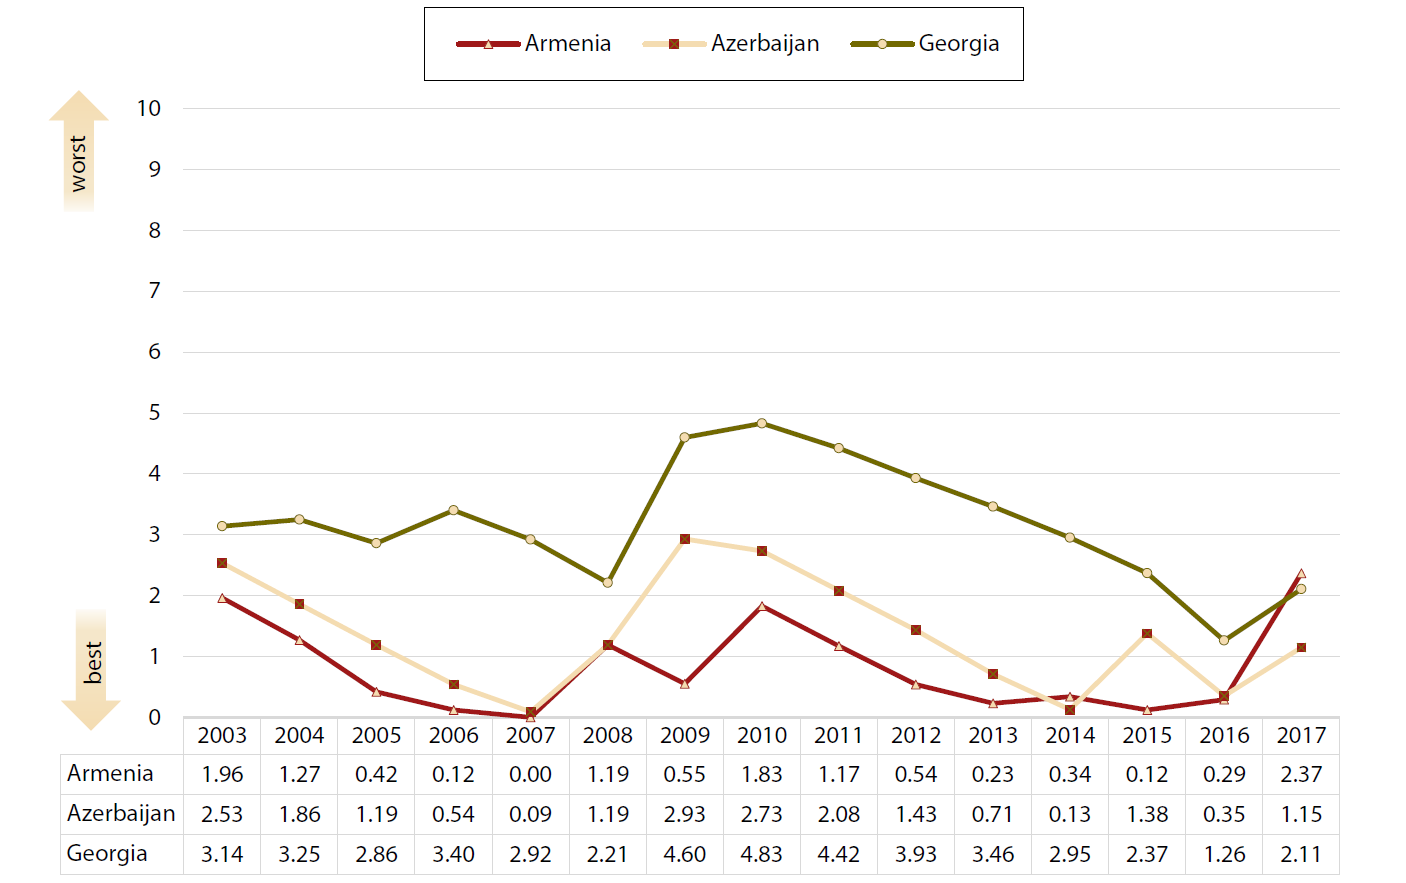
Figure 12: Institute for Economics and Peace: The Global Terrorism Index
Range of scores: 0 (best) to 10 (worst)
Reporters without Borders: Press Freedom Index
Prepared by: Reporters without Borders (Paris, France)
Established: 2002
Frequency: Annual
The ranking covers about 12 months up to the summer of the indicated year.
Countries included: 180 (2017)
Range of scores: 0 (best) to 100 (worst) (since 2013)
URL: <external pagehttps://rsf.org/en/detailed-methodology>
Figure 13: Reporters without Borders: Press Freedom Index
Range of scores: 0 (best) to 100 (worst)
Transparency International: Corruption Perceptions Index (CPI)
Prepared by: Transparency International (Berlin, Germany)
Established: 1995
Frequency: Annual
The years indicated in the ranking refer to the year covered, up to 2012 to the indicated year and the preceding year.
Countries included: 176 (2017)
URL: <external pagehttps://www.transparency.org/news/feature/corruption_perceptions_index_2016>
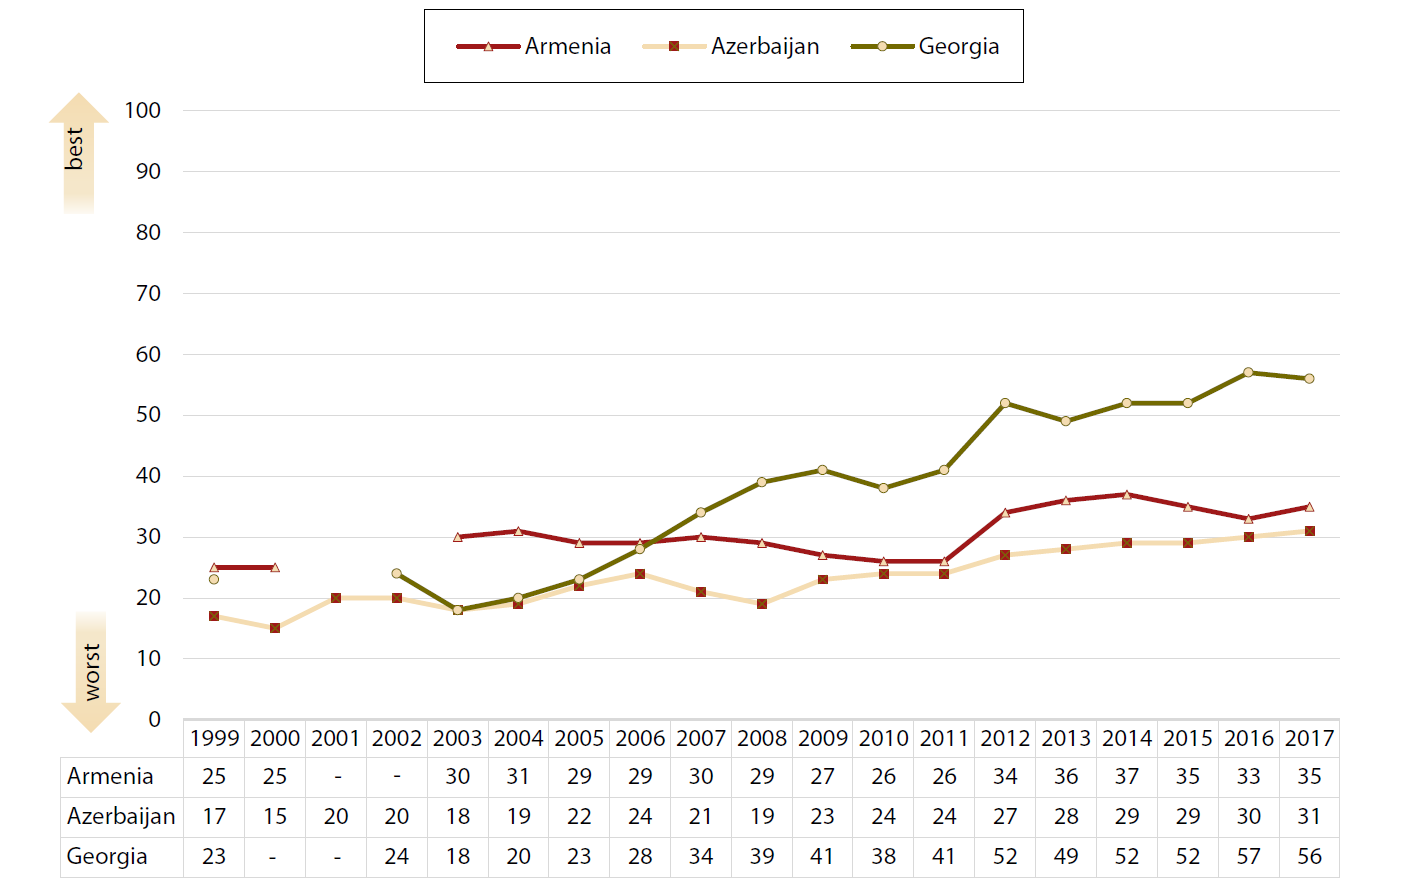
Figure 14: Transparency International: Corruption Perceptions Index (CPI)
Range of scores: 0 (worst) to 100 (best) (since 2012, earlier values have been adjusted)
World Bank: Worldwide Governance Indicators
Prepared by: World Bank (Washington, USA)
Established: 1996
Frequency: Until 2002 every two years, since 2002 annually.
The years indicated in the ranking refer to the year covered.
Countries included: 214 countries and territories (2016)
URL: <http://info.worldbank.org/governance/wgi/index.aspx#doc>
Figure 15: World Bank: Worldwide Governance Indicators—Voice and Accountability
Percentile Rank: 0 (worst) to 100 (best)
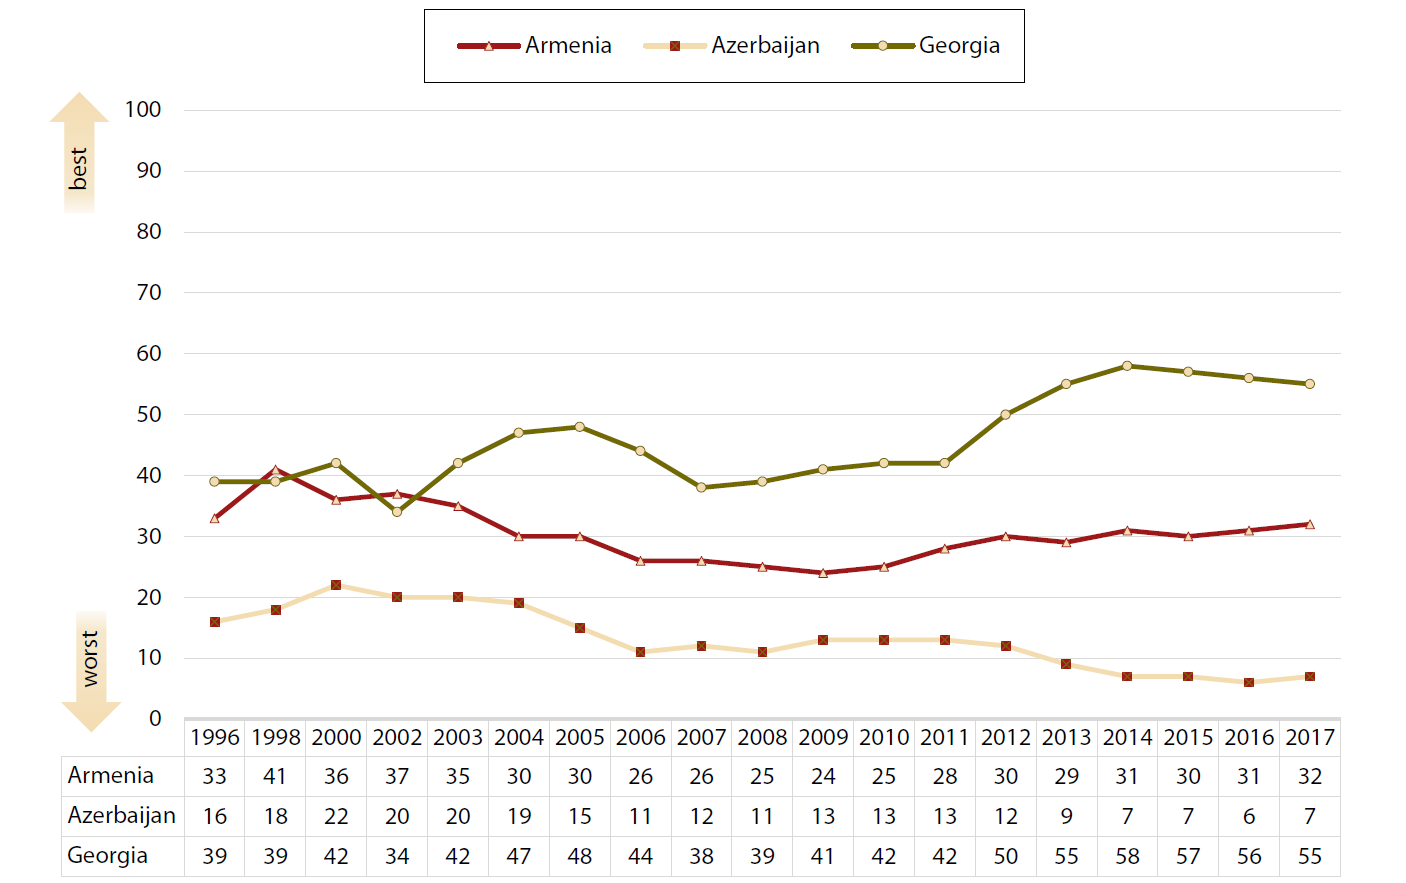
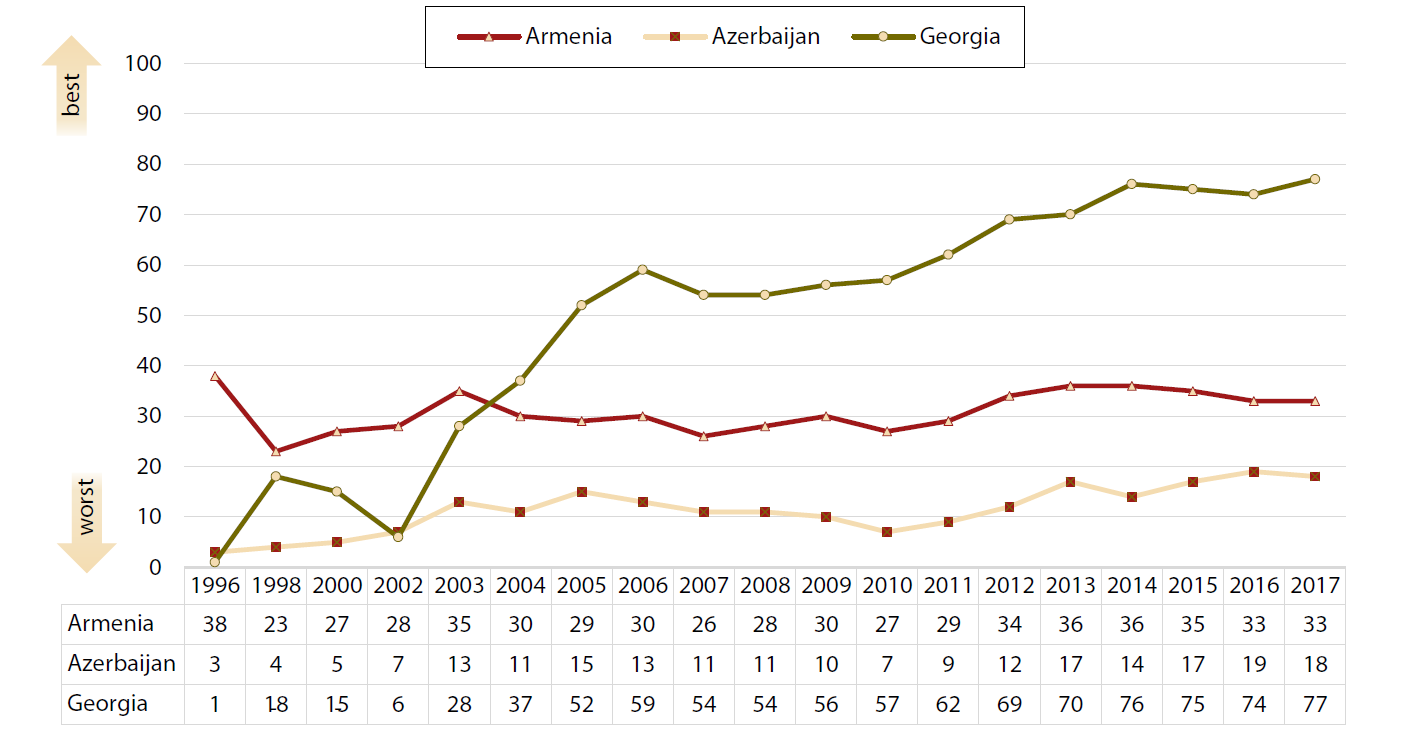
Figure 16: World Bank: Worldwide Governance Indicators—Rule of Law
Percentile Rank: 0 (worst) to 100 (best)
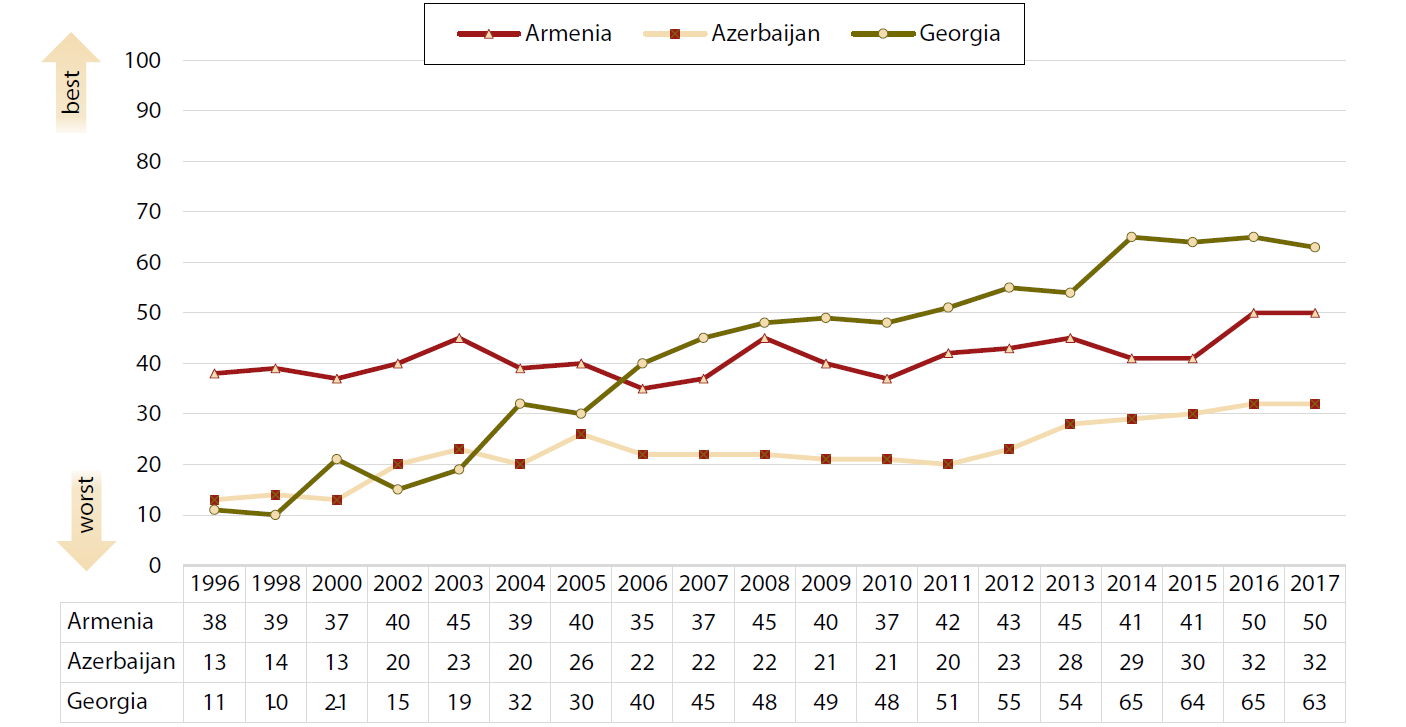
Figure 17: World Bank: Worldwide Governance Indicators—Control of Corruption
Percentile Rank: 0 (worst) to 100 (best)
For more information on issues and events that shape our world, please visit the CSS Blog Network or browse our Digital Library.